Fig. 5.
Download original image
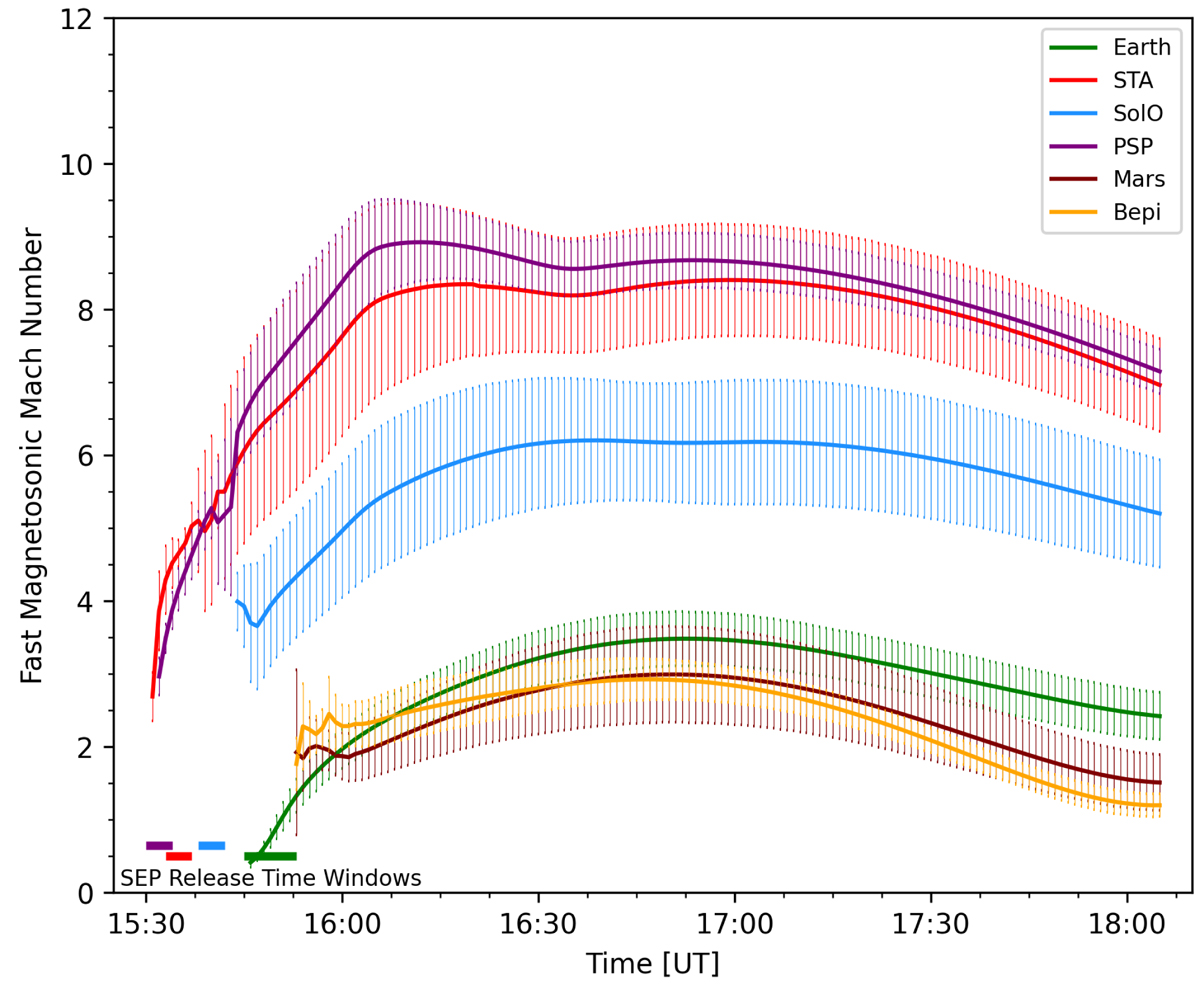
Temporal evolution of the mean fast-magnetosonic Mach number at the field lines connected to each spacecraft, using the connectivity from MAS. The solid coloured lines depict the mean value of Mfm and the vertical error bars are the one-sigma values. The horizontal bars depict the SEP release time windows that are determined from the VDA, for each observer.
Current usage metrics show cumulative count of Article Views (full-text article views including HTML views, PDF and ePub downloads, according to the available data) and Abstracts Views on Vision4Press platform.
Data correspond to usage on the plateform after 2015. The current usage metrics is available 48-96 hours after online publication and is updated daily on week days.
Initial download of the metrics may take a while.