Fig. 3.
Download original image
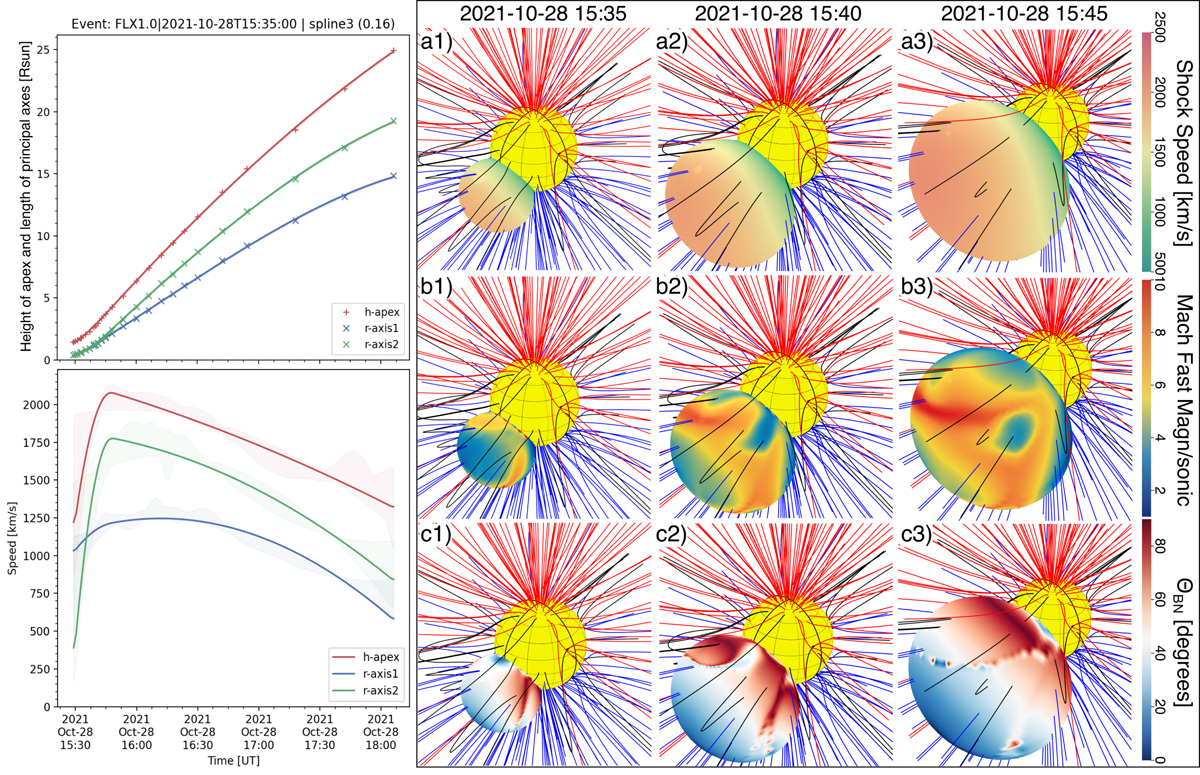
Results from the 3D reconstruction and modelling of the shock. The two panels on the left present the kinematics of the reconstructed shock using the geometrical ellipsoid model. The top (bottom) panel shows the height (speed) of the shock apex measured from the Sun centre and the lengths (speeds) of the two semi-principal axes of the model. The multi-panel on the right shows selected snapshots of the modelled shock wave parameters in 3D plotted along the reconstructed pressure wavefront surface. Row (a) shows the shock speed, (b) the fast-magnetosonic Mach number, and (c) the shock geometry (ΘBN angle). The Sun is plotted to scale (yellow sphere) and the open (red or blue depending on the polarity) and closed (black) coronal field lines traced from the MAS model are also shown.
Current usage metrics show cumulative count of Article Views (full-text article views including HTML views, PDF and ePub downloads, according to the available data) and Abstracts Views on Vision4Press platform.
Data correspond to usage on the plateform after 2015. The current usage metrics is available 48-96 hours after online publication and is updated daily on week days.
Initial download of the metrics may take a while.