Fig. C.1.
Download original image
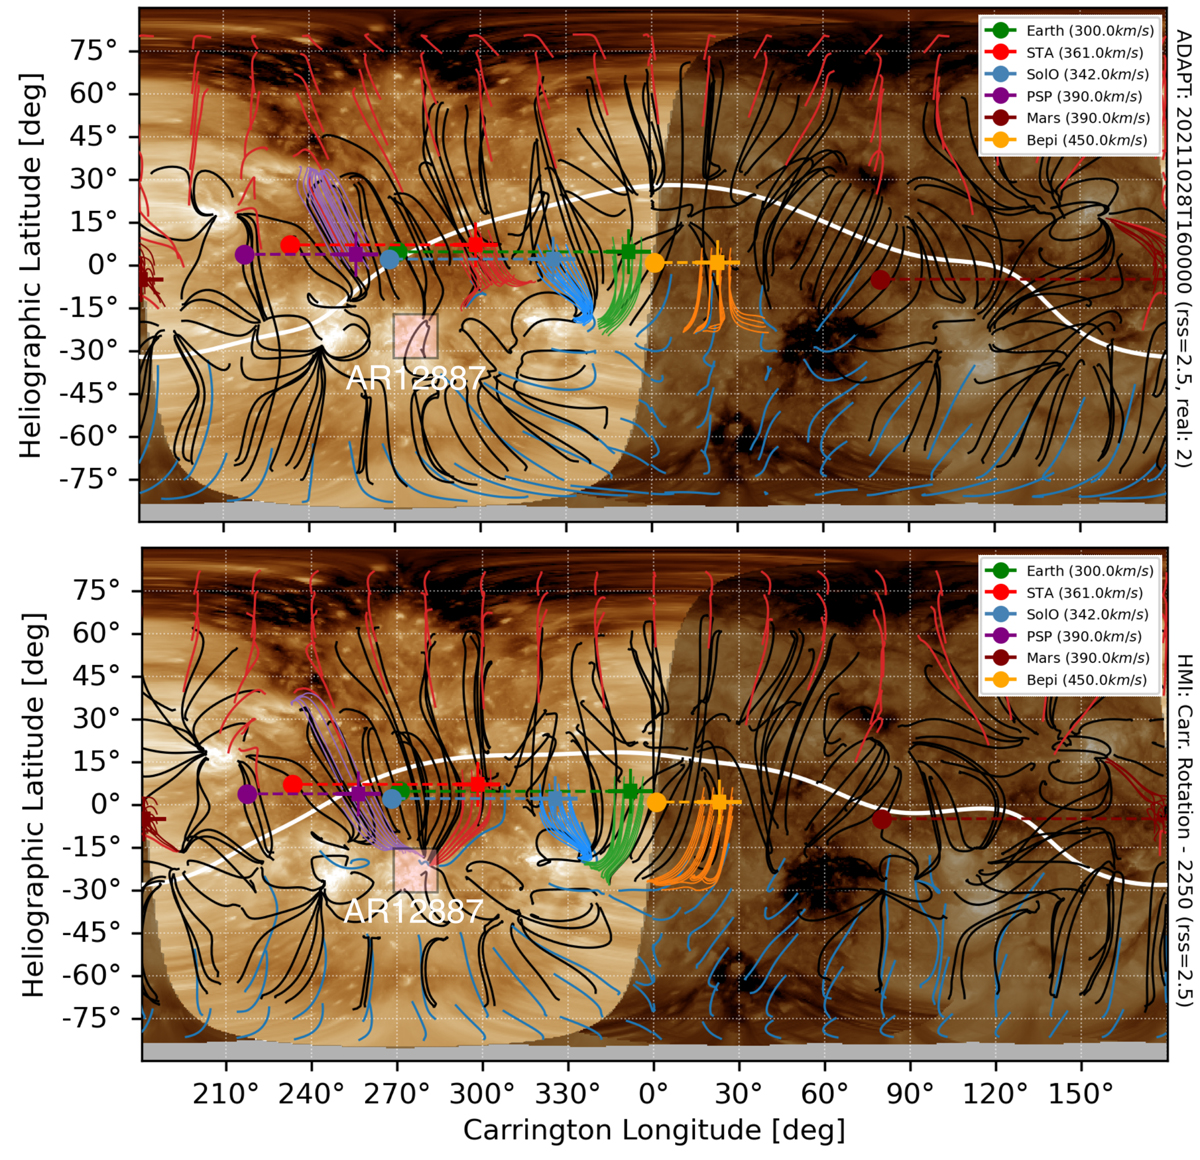
Similar to Fig. 4, but for the magnetic connectivity of the observers to the solar surface using the PFSS model and two different input magnetograms. The top panel shows the magnetic connectivity based on the ADAPT photospheric magnetic field map on 16:00 UT (second realization) and the bottom panel using the SDO/HMI synoptic maps. The observers’ positions are depicted as coloured circles. The Parker spirals are shown with the dashed coloured lines and the footpoints of the spirals at the source surface (2.5 R⊙) are shown with the coloured squares. The traced magnetic field lines from the PFSS model that connect to each observer are depicted with the coloured lines, and the open (red or blue depending on the polarity) and closed (black) field lines from the PFSS model are presented. The neutral line at the source surface is shown with the white line. The background map is constructed using SDO/AIA images at 193 Å.
Current usage metrics show cumulative count of Article Views (full-text article views including HTML views, PDF and ePub downloads, according to the available data) and Abstracts Views on Vision4Press platform.
Data correspond to usage on the plateform after 2015. The current usage metrics is available 48-96 hours after online publication and is updated daily on week days.
Initial download of the metrics may take a while.