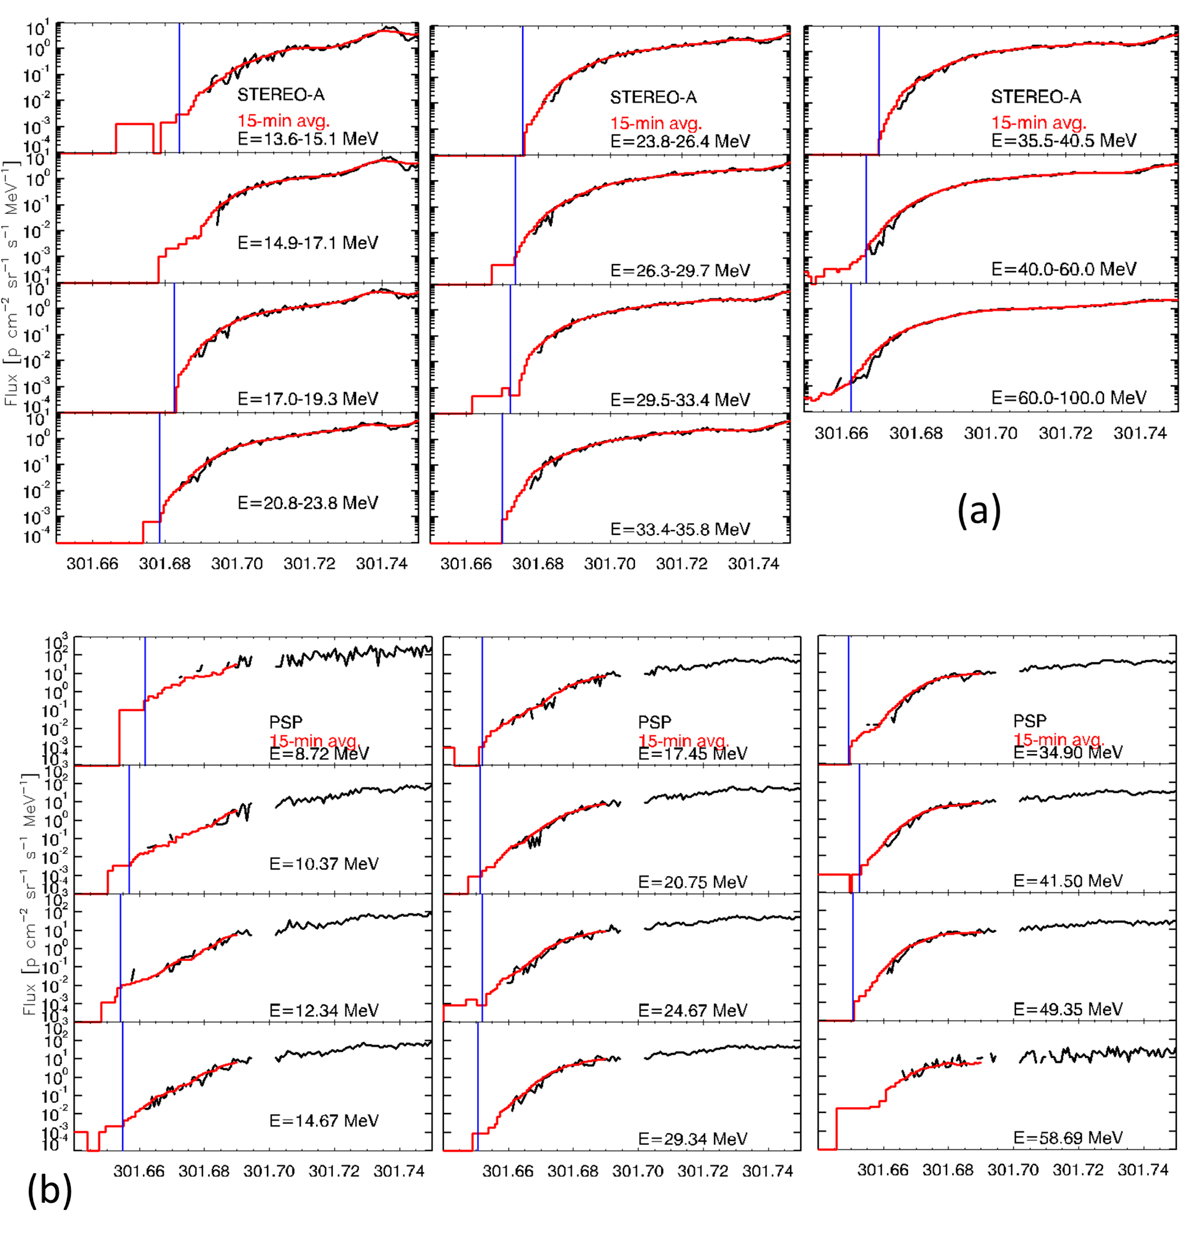
Fig. B.1.
Download original image
Onset of the 28 October 2021 SEP event as observed in the proton energy channels of (a) STA/HET and (b) PSP/HET. The black lines are one-minute averages, whereas the red lines are long-term averages (as indicated in the panels). The blue vertical lines indicate the onset time identified per channel and used in the analysis.
Current usage metrics show cumulative count of Article Views (full-text article views including HTML views, PDF and ePub downloads, according to the available data) and Abstracts Views on Vision4Press platform.
Data correspond to usage on the plateform after 2015. The current usage metrics is available 48-96 hours after online publication and is updated daily on week days.
Initial download of the metrics may take a while.