Fig. 1.
Download original image
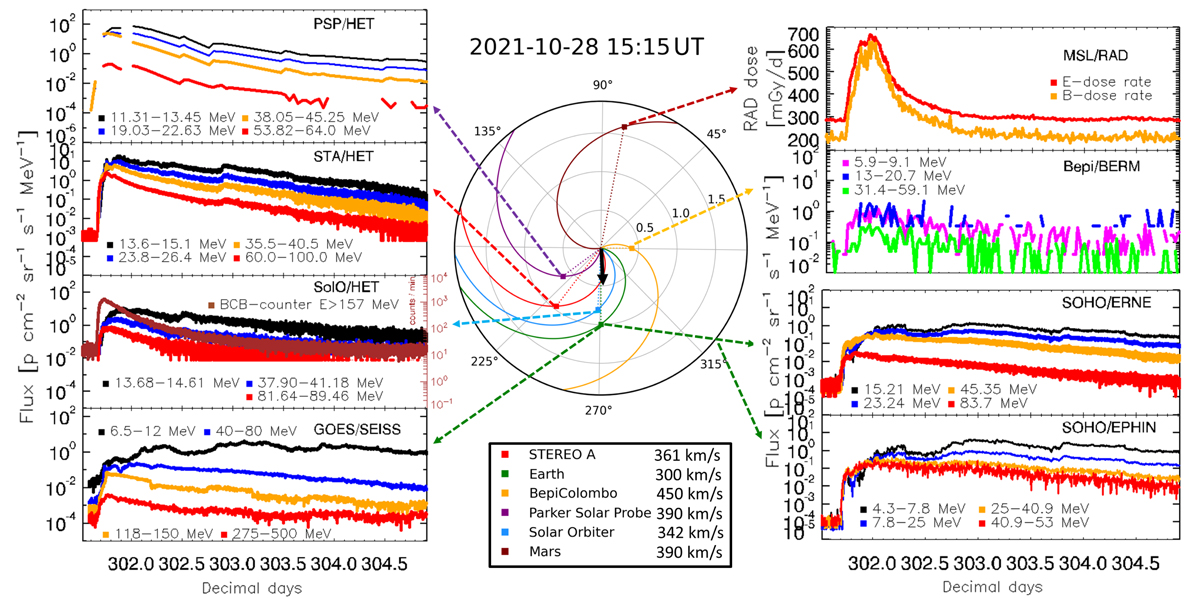
View of the equatorial plane with the location of planets and spacecraft on 28 October 2021, and the SEP recordings during the solar event. The middle panel shows the heliographic equatorial plane from the north, in the Stonyhurst coordinate system, and the location of different spacecraft (coloured squares) at 15:15 UT. The Parker spirals from the Sun to each spacecraft are shown. The measured (or inferred) solar wind speed used for each observer is provided in the bottom part of the middle panel. The large coloured arrows point to the in situ measurements from each observer shown in the left and right multi-panels. In each panel are shown the measurements of energetic protons. In particular the recordings from PSP/HET (11.31–64.0 Mev), STA/HET (13.6–100 MeV), Solo/HET (13.68–89.46 MeV and E > 157 MeV), GOES/SEISS (6.5–500 MeV), SOHO/EPHIN (4.3–53 MeV), SOHO/ERNE (15.21–68.7 MeV), Bepi/BERM (5.9–59.1 MeV) and MSL/RAD dose rates are presented (anti-clockwise from top left). The black solid arrow denotes the propagation direction of the apex.
Current usage metrics show cumulative count of Article Views (full-text article views including HTML views, PDF and ePub downloads, according to the available data) and Abstracts Views on Vision4Press platform.
Data correspond to usage on the plateform after 2015. The current usage metrics is available 48-96 hours after online publication and is updated daily on week days.
Initial download of the metrics may take a while.