Fig. 8
Download original image
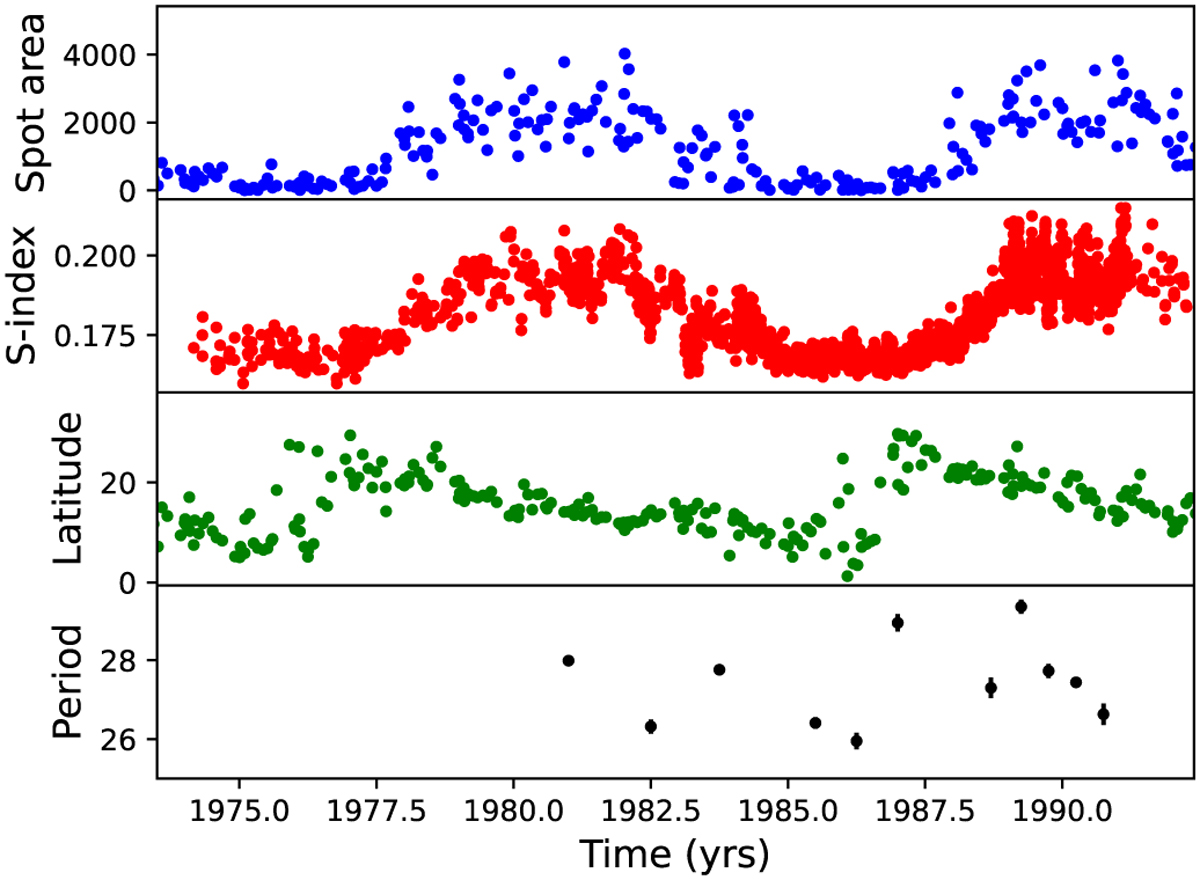
Variations in the Sun. The upper panel shows the variation in the total sunspot area, the second panel the SMWO values from the Mount Wilson programme, the third panel the mean weighted latitude of the sunspots, and the last panel the rotation periods. In the bottom panel, the black dots denote our own rotation period measurements.
Current usage metrics show cumulative count of Article Views (full-text article views including HTML views, PDF and ePub downloads, according to the available data) and Abstracts Views on Vision4Press platform.
Data correspond to usage on the plateform after 2015. The current usage metrics is available 48-96 hours after online publication and is updated daily on week days.
Initial download of the metrics may take a while.