Fig. A.3.
Download original image
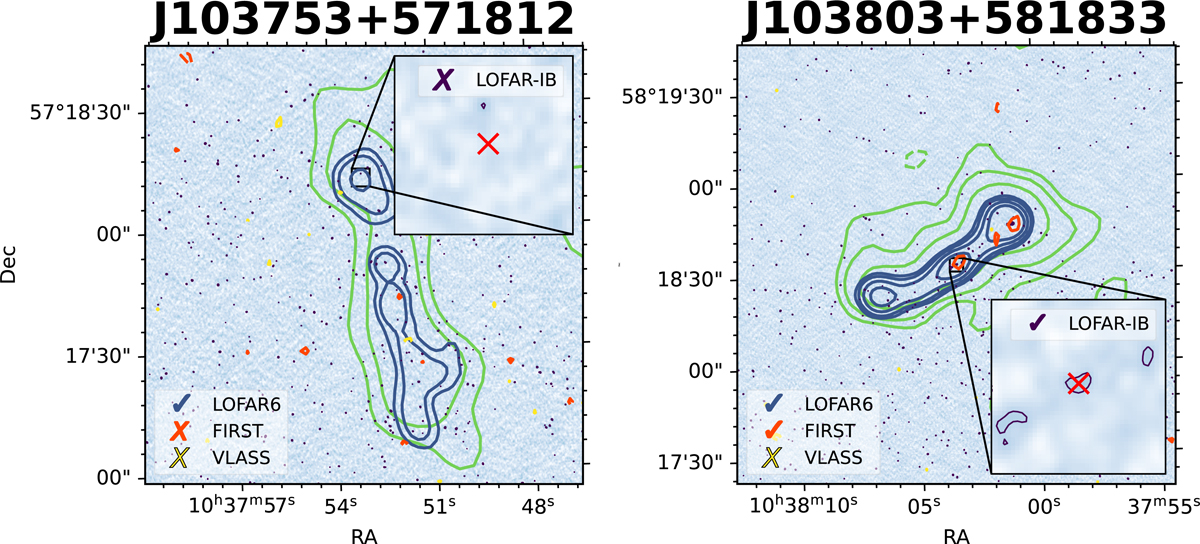
Radio images of active comparison radio galaxies. LOFAR-IB colourmap with contours from the LOFAR18 image in green, LOFAR6 in blue, FIRST in red, VLASS in yellow, and an inset zoomed in on the central part with the LOFAR-IB contours in purple. Contour levels are the same as in Fig. A.1. If the central part of the source is detected in radio images, it is denoted with ‘✓’ in the legend. If the central part is not detected, it is noted with ‘✗’. The yellow ’+’ represents the position of the optical host galaxy. If the optical host galaxy is not identified, the expected position of the nuclear region is noted with red ‘×’.
Current usage metrics show cumulative count of Article Views (full-text article views including HTML views, PDF and ePub downloads, according to the available data) and Abstracts Views on Vision4Press platform.
Data correspond to usage on the plateform after 2015. The current usage metrics is available 48-96 hours after online publication and is updated daily on week days.
Initial download of the metrics may take a while.