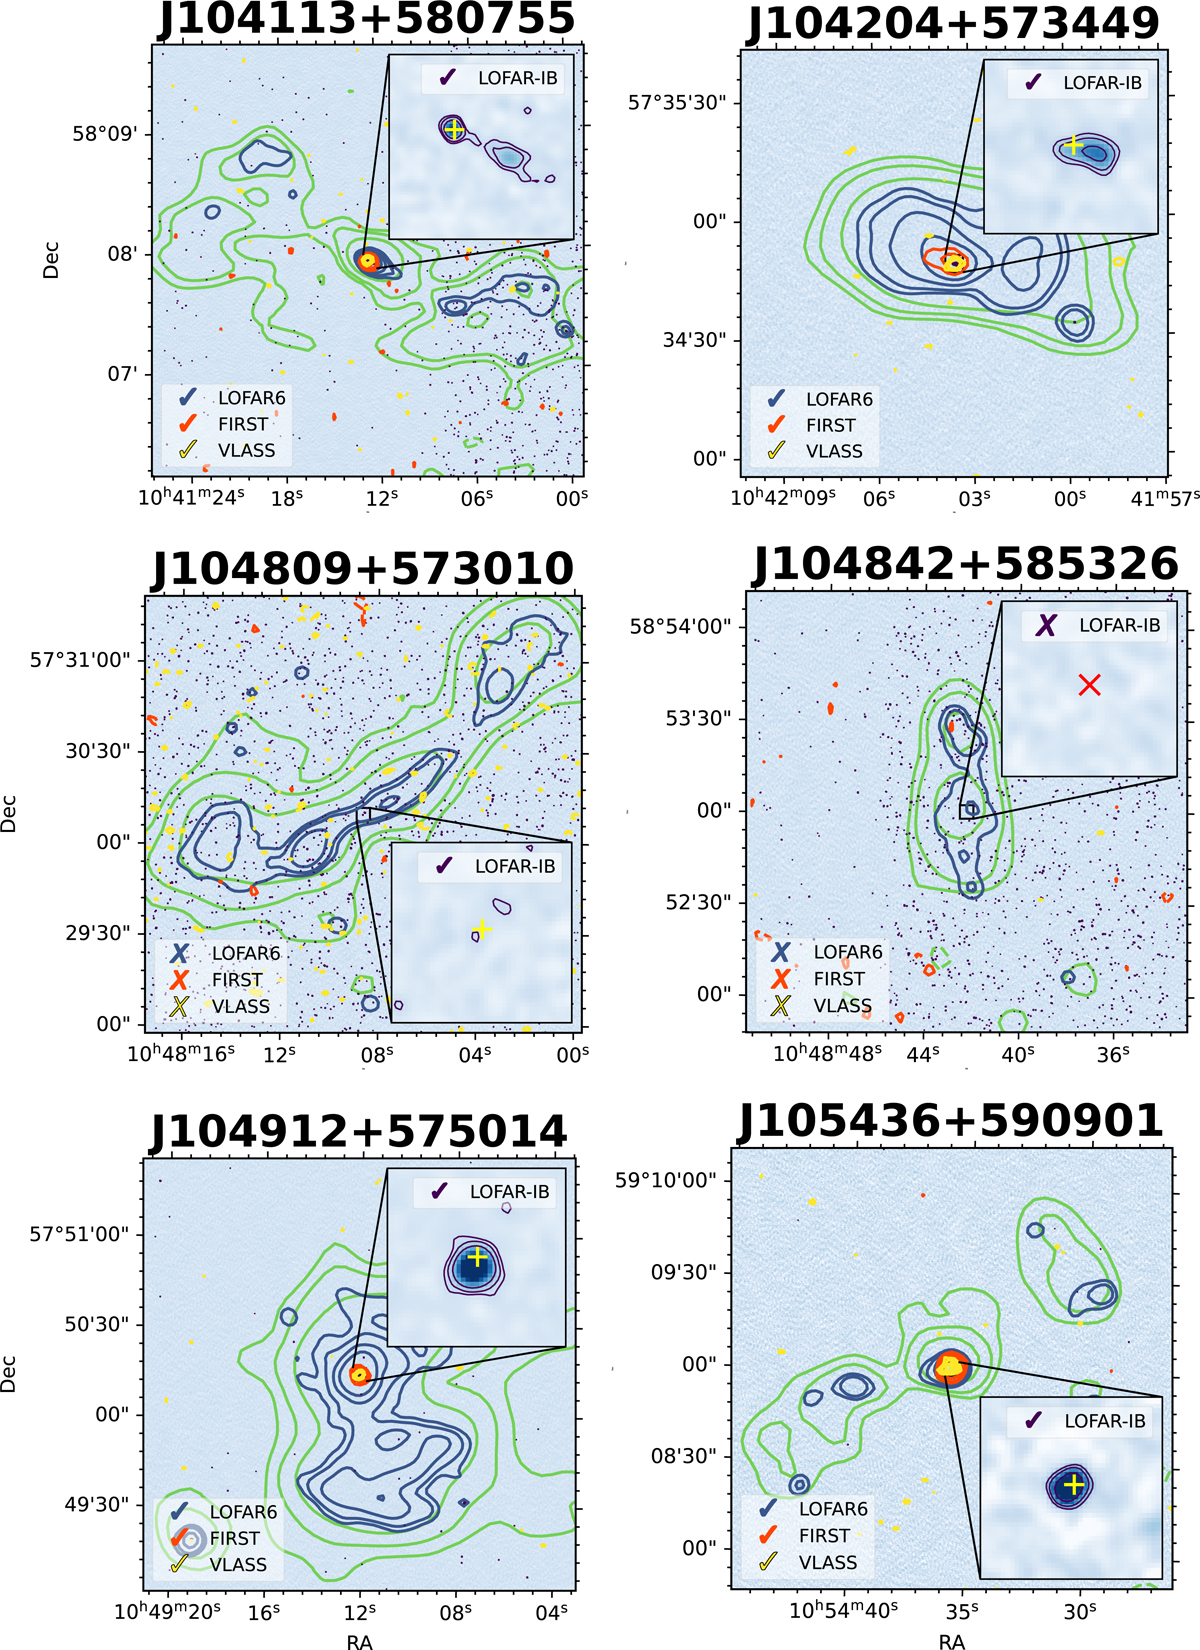
Fig. A.1.
Download original image
Radio images of restarted candidates. The colourmaps are LOFAR-IB with contours from the LOFAR18 (green; -3, 3, 5, 10 × σlocal); LOFAR6 (blue; -3, 3, 5, 10, 20, 100, 200 × σmedian); LOFAR-IB (purple; -3, 3, 5, 10 × σlocal); FIRST (red; -3, 3, 5, 10 × σlocal); VLASS (yellow; -3, 3, 5, 10, 20 × σlocal). The inset is zoomed in on the central region. The yellow ‘+’ in the inset notes the position of the optical host galaxy. If there is no optical counterpart, red ‘×’ notes the expected position of the nuclear region. Detection (‘✓’) or non-detection (‘✗’) of the central region is noted in the legends.
Current usage metrics show cumulative count of Article Views (full-text article views including HTML views, PDF and ePub downloads, according to the available data) and Abstracts Views on Vision4Press platform.
Data correspond to usage on the plateform after 2015. The current usage metrics is available 48-96 hours after online publication and is updated daily on week days.
Initial download of the metrics may take a while.