Fig. 4.
Download original image
![]() vs
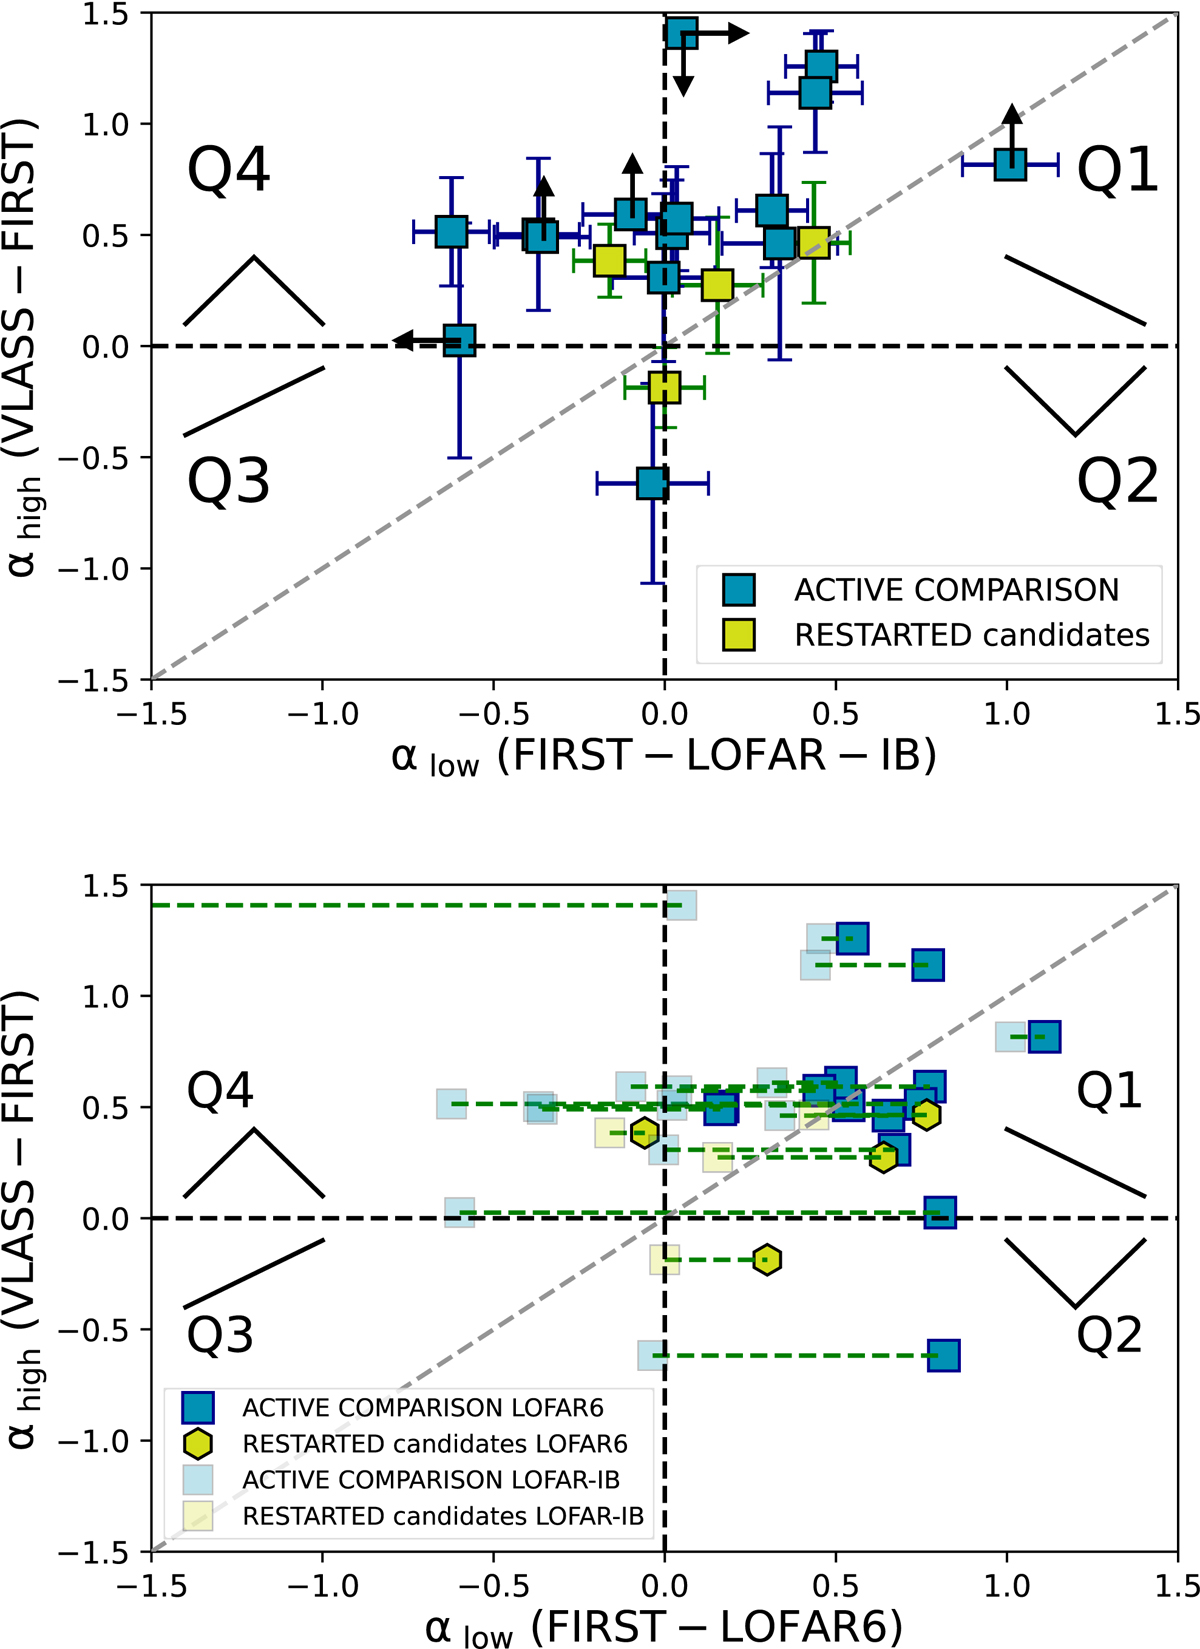
vs ![]() . The one-to-one relation of αlow and αhigh is shown with a dashed grey line. The dashed black lines represent spectral indices of zero, dividing the plot in four quadrants (Q1, Q2, Q3, and Q4). The black lines in the corner of each quadrant illustrate the shape of the spectrum. We remind the reader that α is defined as Sν ∝ ν−α. Arrows indicate upper or lower limits. In the upper panel, we use LOFAR-IB flux density measurements, while in the lower panel, we use LOFAR6 flux densities and compare them to their position in the upper panel.
. The one-to-one relation of αlow and αhigh is shown with a dashed grey line. The dashed black lines represent spectral indices of zero, dividing the plot in four quadrants (Q1, Q2, Q3, and Q4). The black lines in the corner of each quadrant illustrate the shape of the spectrum. We remind the reader that α is defined as Sν ∝ ν−α. Arrows indicate upper or lower limits. In the upper panel, we use LOFAR-IB flux density measurements, while in the lower panel, we use LOFAR6 flux densities and compare them to their position in the upper panel.
Current usage metrics show cumulative count of Article Views (full-text article views including HTML views, PDF and ePub downloads, according to the available data) and Abstracts Views on Vision4Press platform.
Data correspond to usage on the plateform after 2015. The current usage metrics is available 48-96 hours after online publication and is updated daily on week days.
Initial download of the metrics may take a while.