Fig. 3.
Download original image
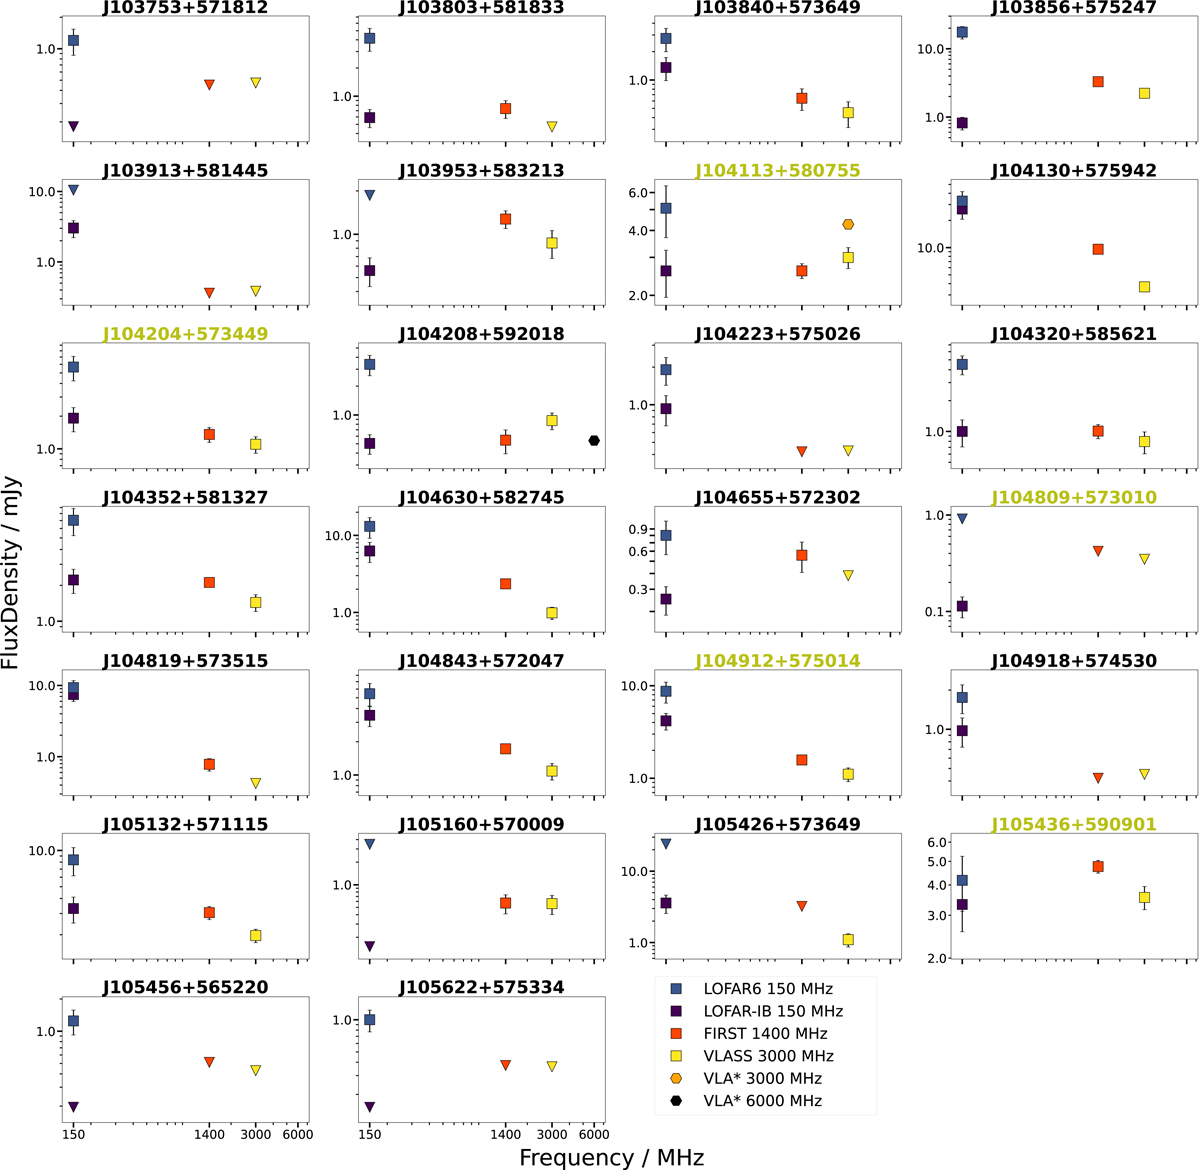
Radio spectra of the cores of the 26 sources in the sample. Flux density measurements from LOFAR image at 150 MHz (LOFAR-IB in purple and LOFAR6 in blue), FIRST images at 1.4 GHz (in red), VLASS images at 3 GHz (in yellow), and VLA at 3 GHz and 6 GHz (in orange and black, respectively; only for two sources; see Appendix C). Triangles indicate upper limits. Restarted candidates are indicated with a green title, and the rest belong to the active comparison sample.
Current usage metrics show cumulative count of Article Views (full-text article views including HTML views, PDF and ePub downloads, according to the available data) and Abstracts Views on Vision4Press platform.
Data correspond to usage on the plateform after 2015. The current usage metrics is available 48-96 hours after online publication and is updated daily on week days.
Initial download of the metrics may take a while.