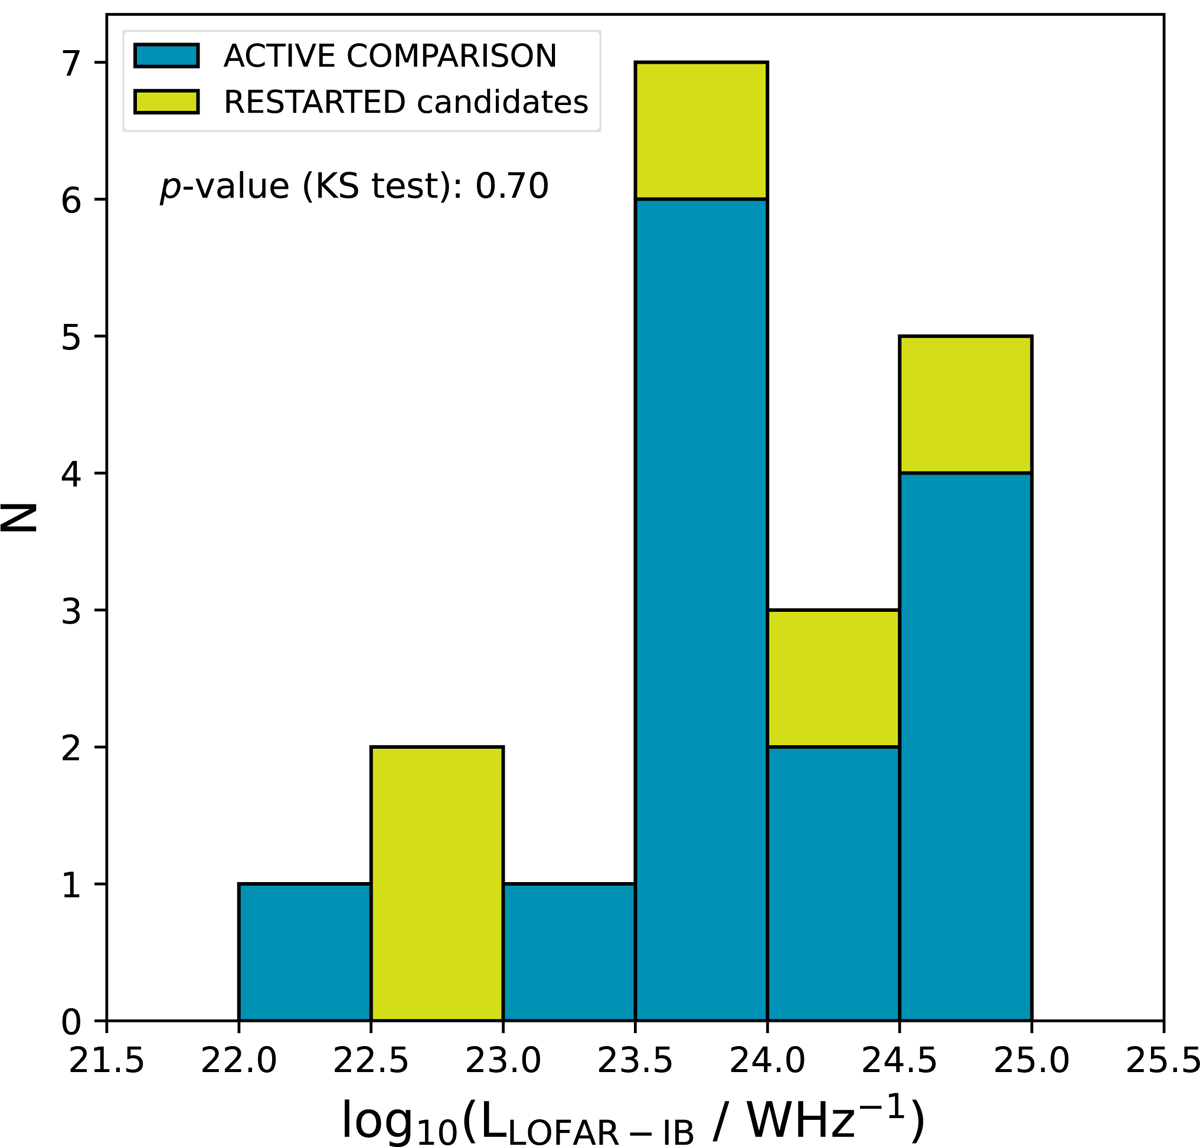
Fig. 2.
Download original image
Stacked bar chart showing LOFAR-IB radio luminosities of detected central regions at 150 MHz of candidate restarted (green) and comparison active (blue) radio galaxies with SDSS optical counterparts. At the top of the histogram, we report the p-value from the Kolmogorov–Smirnov (KS) comparison of two datasets (see, Sect. 6).
Current usage metrics show cumulative count of Article Views (full-text article views including HTML views, PDF and ePub downloads, according to the available data) and Abstracts Views on Vision4Press platform.
Data correspond to usage on the plateform after 2015. The current usage metrics is available 48-96 hours after online publication and is updated daily on week days.
Initial download of the metrics may take a while.