Fig. A.4.
Download original image
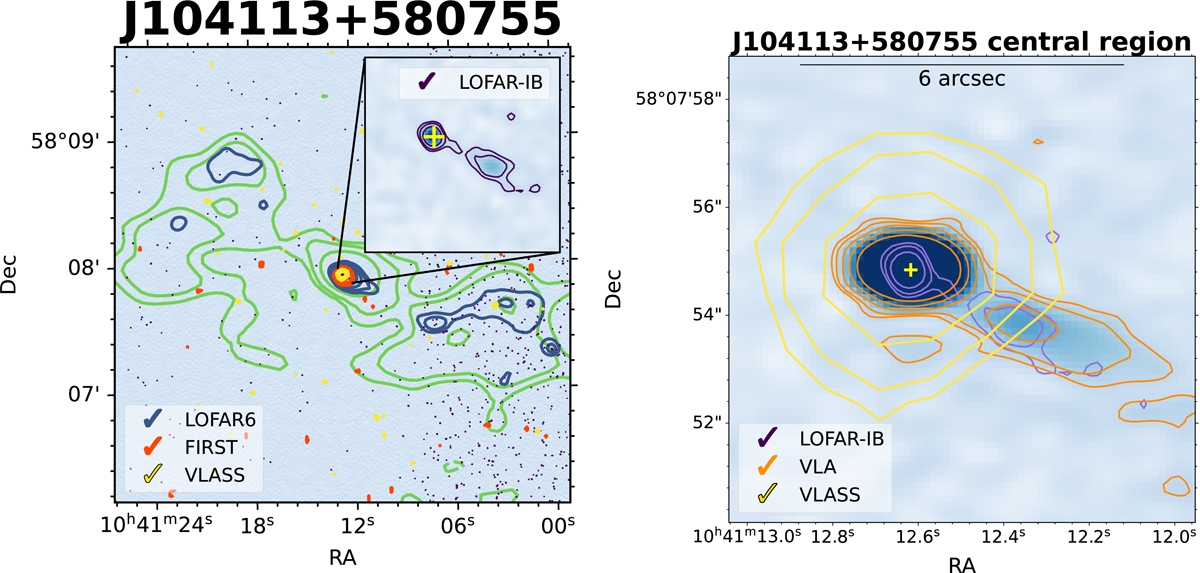
Radio images of the candidate restarted radio galaxy J104113+580755. The left panel displays the LOFAR-IB image, and the right panel shows a zoomed-in view of the central region from the dedicated VLA observation presented in Appendix C. Contour colours and levels in the left panel are the same as in Fig. A.1. In the right panel are LOFAR-IB contours in purple (-3, 3, 5, 10 × σ; σ = 35 μJy), VLA in orange (-3, 3, 5, 10, 20, 40 × σ; σ = 12 μJy), and VLASS in yellow (-3, 3, 5, 10 × σ; σ = 150 μJy). The yellow ‘+’ in the inset and in the right panel indicates the position of the optical host galaxy. The detection of the central region in the respective images is noted with ‘✓’ in the legend.
Current usage metrics show cumulative count of Article Views (full-text article views including HTML views, PDF and ePub downloads, according to the available data) and Abstracts Views on Vision4Press platform.
Data correspond to usage on the plateform after 2015. The current usage metrics is available 48-96 hours after online publication and is updated daily on week days.
Initial download of the metrics may take a while.