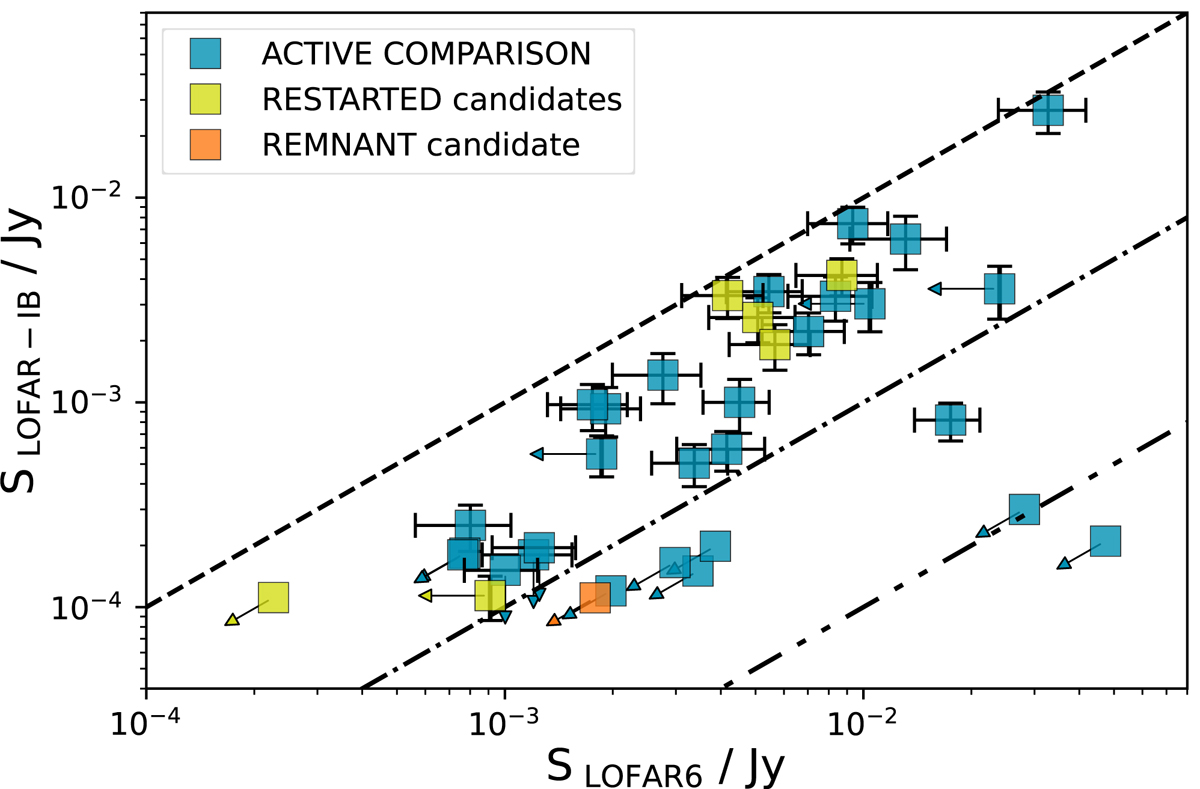
Fig. 1.
Download original image
LOFAR6 peak flux density vs LOFAR-IB peak or integrated flux density. The only remnant candidate is indicated in orange, restarted candidates in green, and sources from the active comparison sample in blue. Arrows indicate upper limits on flux densities. The dashed line indicates one-to-one relation, the dash-dotted line indicates a factor of 10 difference between the two flux densities at 150 MHz, while the dash-double-dot line indicates a factor of 100 difference. See Sect. 5.2 for details.
Current usage metrics show cumulative count of Article Views (full-text article views including HTML views, PDF and ePub downloads, according to the available data) and Abstracts Views on Vision4Press platform.
Data correspond to usage on the plateform after 2015. The current usage metrics is available 48-96 hours after online publication and is updated daily on week days.
Initial download of the metrics may take a while.