Open Access
Fig. 15.
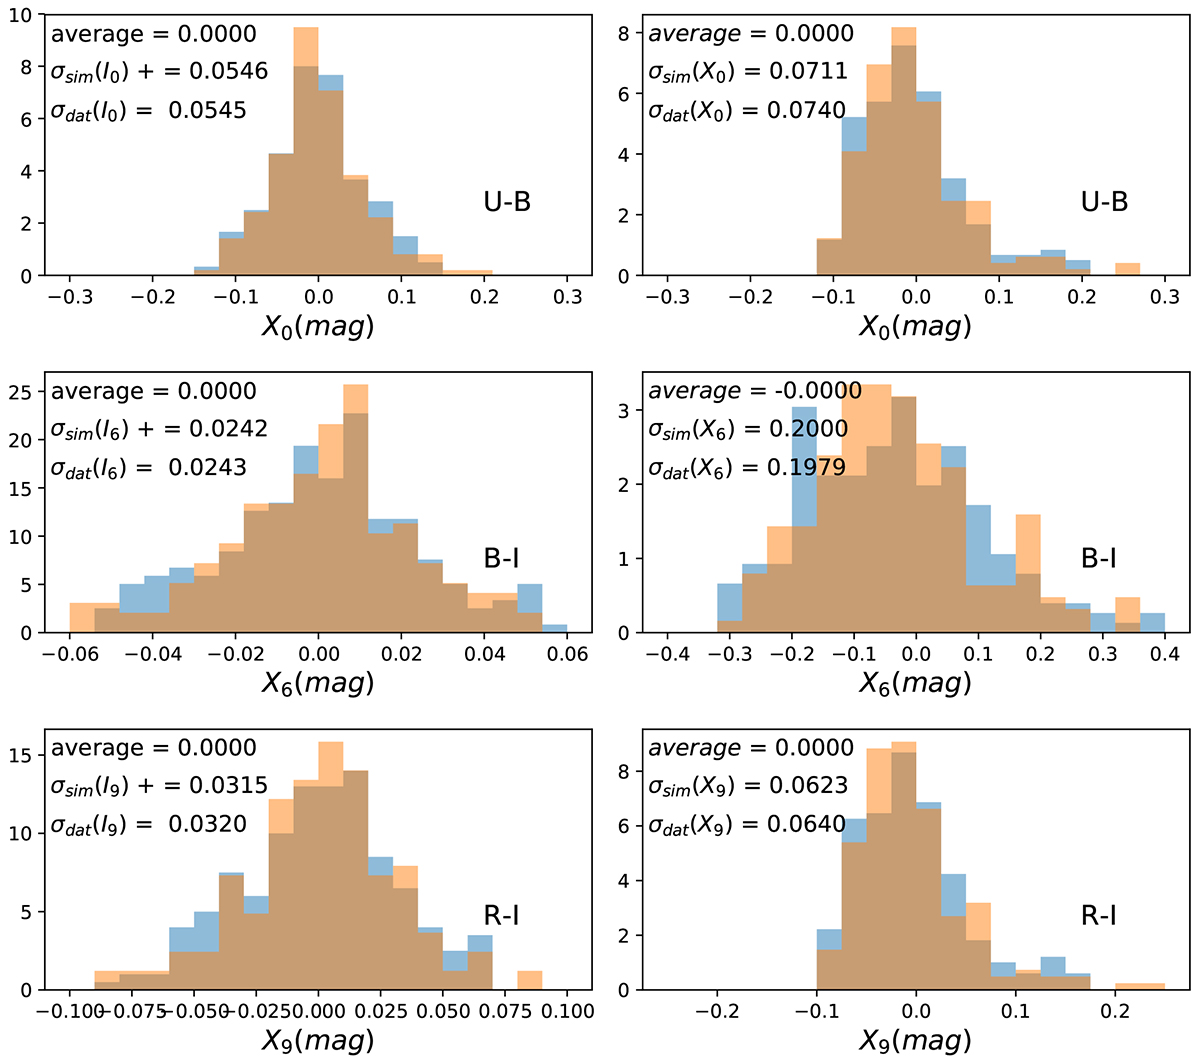
Download original image
Residuals in observations and simulations for colours c0, c2, c5, c6, c8, and c9 (RV = 2.25). The RMS of the residuals of all colours are given in Table 9. The blue shade is the simulated distribution, the orange shade the data.
Current usage metrics show cumulative count of Article Views (full-text article views including HTML views, PDF and ePub downloads, according to the available data) and Abstracts Views on Vision4Press platform.
Data correspond to usage on the plateform after 2015. The current usage metrics is available 48-96 hours after online publication and is updated daily on week days.
Initial download of the metrics may take a while.