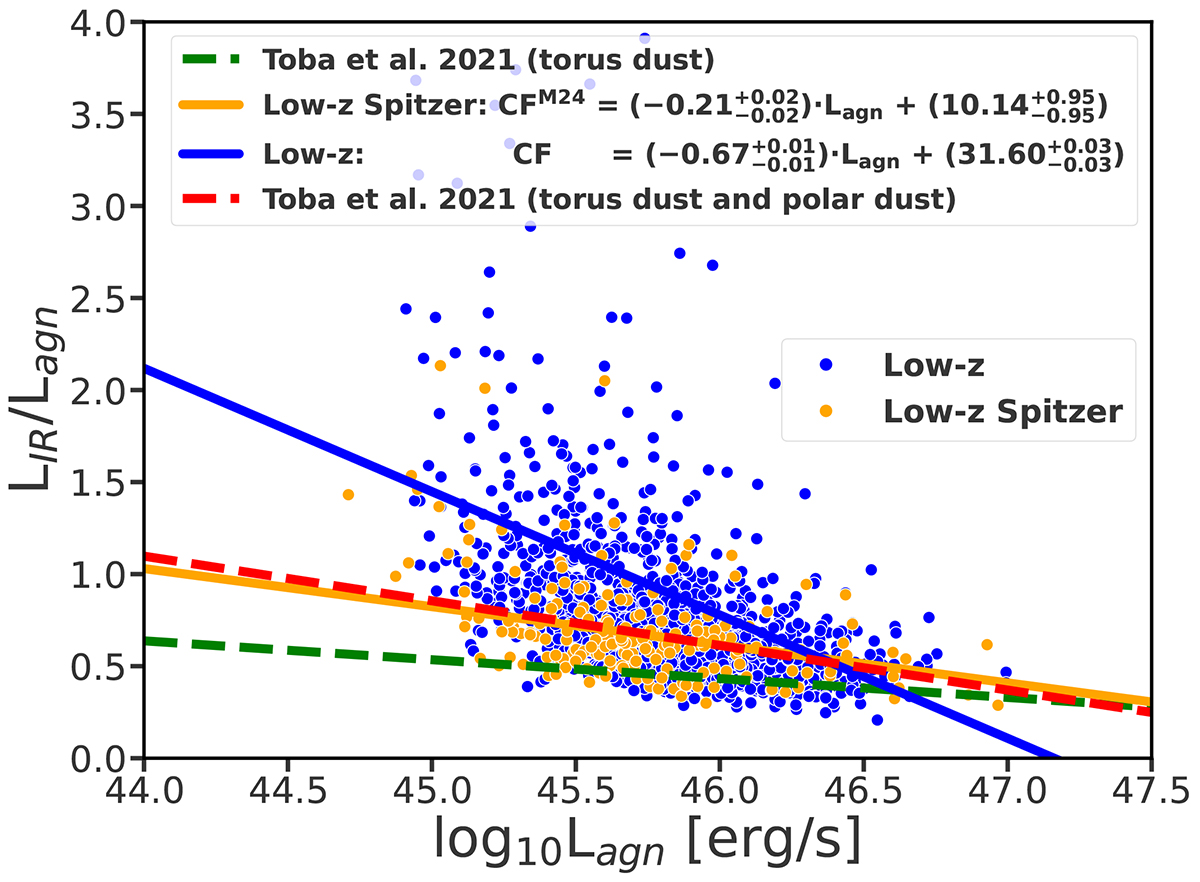
Fig. 9.
Download original image
Regression analysis results for the covering factor and bolometric luminosity for the low-z quasars with S/NW3 & W4 > 5. The blue and orange lines are the same as in Fig. 5. The green line corresponds to the regression from Toba et al. (2021) fitted to the model with torus dust only, while the red line is the sum of regressions fitted to the torus and polar dust models separately.
Current usage metrics show cumulative count of Article Views (full-text article views including HTML views, PDF and ePub downloads, according to the available data) and Abstracts Views on Vision4Press platform.
Data correspond to usage on the plateform after 2015. The current usage metrics is available 48-96 hours after online publication and is updated daily on week days.
Initial download of the metrics may take a while.