Fig. 8.
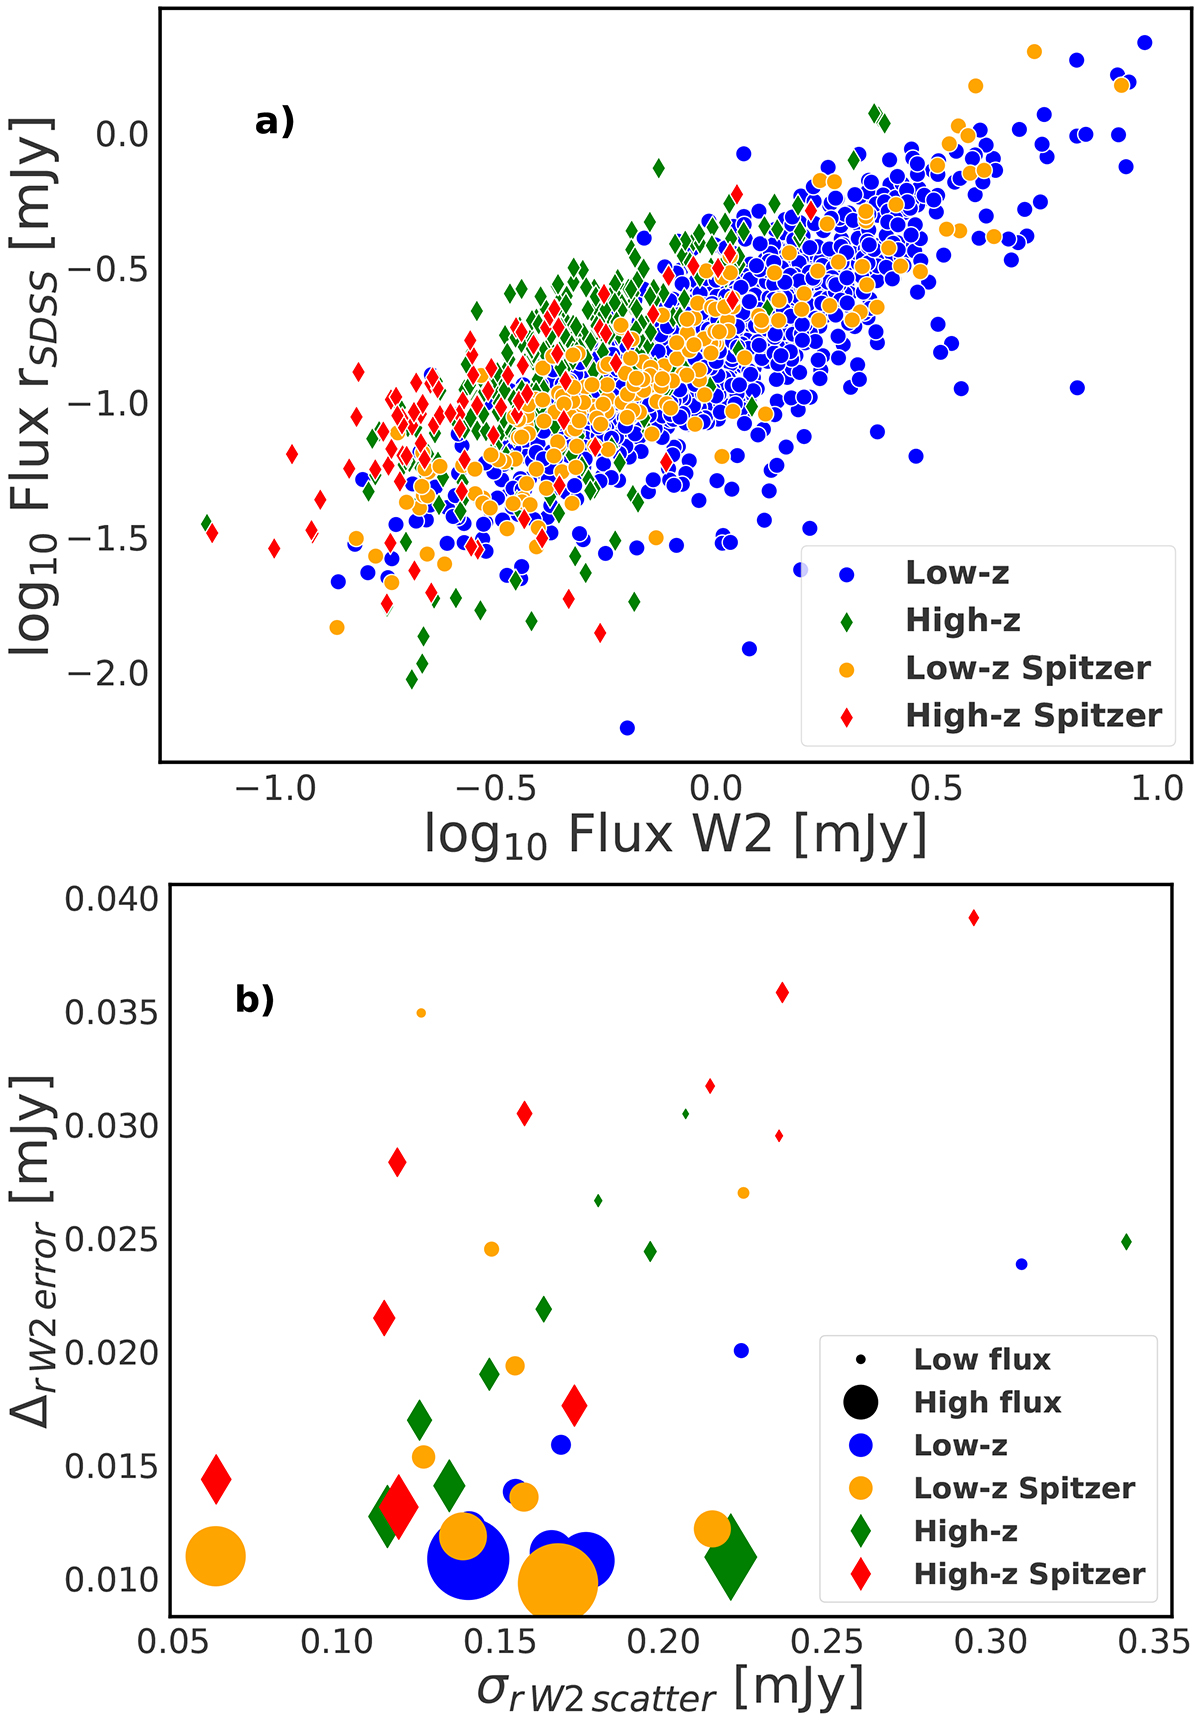
Download original image
Analysis of the intrinsic scatter. Top panel: scatter plot for the extinction corrected log fr and log fW2, for low-z, high-z, low-zSpitzer, and high-zSpitzer. Bottom panel: standard deviation for binned fluxes in the bands r and W2, and the error of log r − W2 relations σr W2 scatter. The bins were calculated as equally distanced in log r space. The sizes of the symbols correspond to the log fr flux values in each bin.
Current usage metrics show cumulative count of Article Views (full-text article views including HTML views, PDF and ePub downloads, according to the available data) and Abstracts Views on Vision4Press platform.
Data correspond to usage on the plateform after 2015. The current usage metrics is available 48-96 hours after online publication and is updated daily on week days.
Initial download of the metrics may take a while.