Fig. 7.
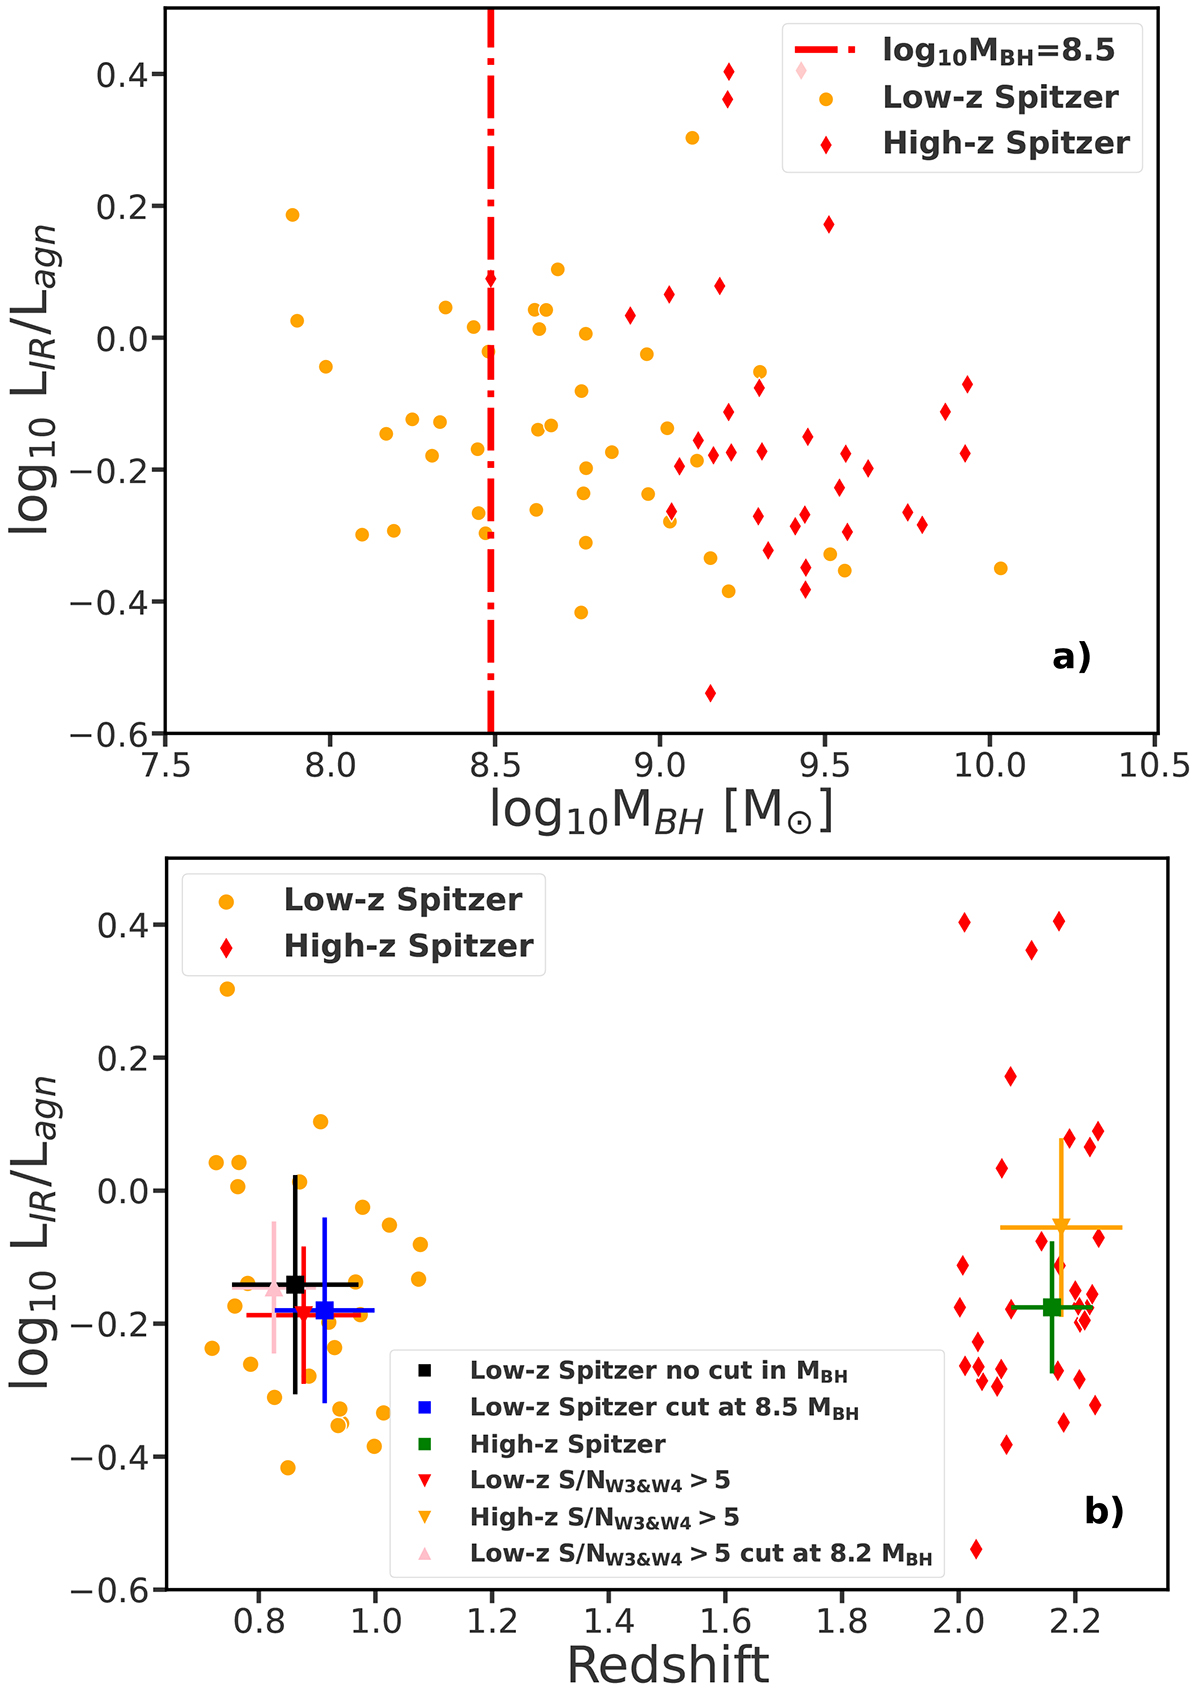
Download original image
Relations of the CF with redshift. The top panel shows the relation between log CF and log MBH for quasars with the Spitzer M24 and VAC data. The red line represents the cut on log MBH/M⊙ = 8.5. The bottom panel shows the relation between log CF and redshift for quasars with log MBH/M⊙ > 8.5. The orange and red points in both panels represent the low-z and high-z quasars, respectively. The large symbols with MAD error bars stand for the medians calculated for each data sample: low-z with no cut in MBH (red triangle), high-z (orange triangle), low-z with the cut in log MBH/M⊙ > 8.2 (pink triangle), low-zSpitzer with no cut in MBH (black square), high-zSpitzer (green square), low-zSpitzer with the cut in log MBH/M⊙ > 8.5 (blue square). For the luminosity and Eddington ratio selection, see Appendix E.
Current usage metrics show cumulative count of Article Views (full-text article views including HTML views, PDF and ePub downloads, according to the available data) and Abstracts Views on Vision4Press platform.
Data correspond to usage on the plateform after 2015. The current usage metrics is available 48-96 hours after online publication and is updated daily on week days.
Initial download of the metrics may take a while.