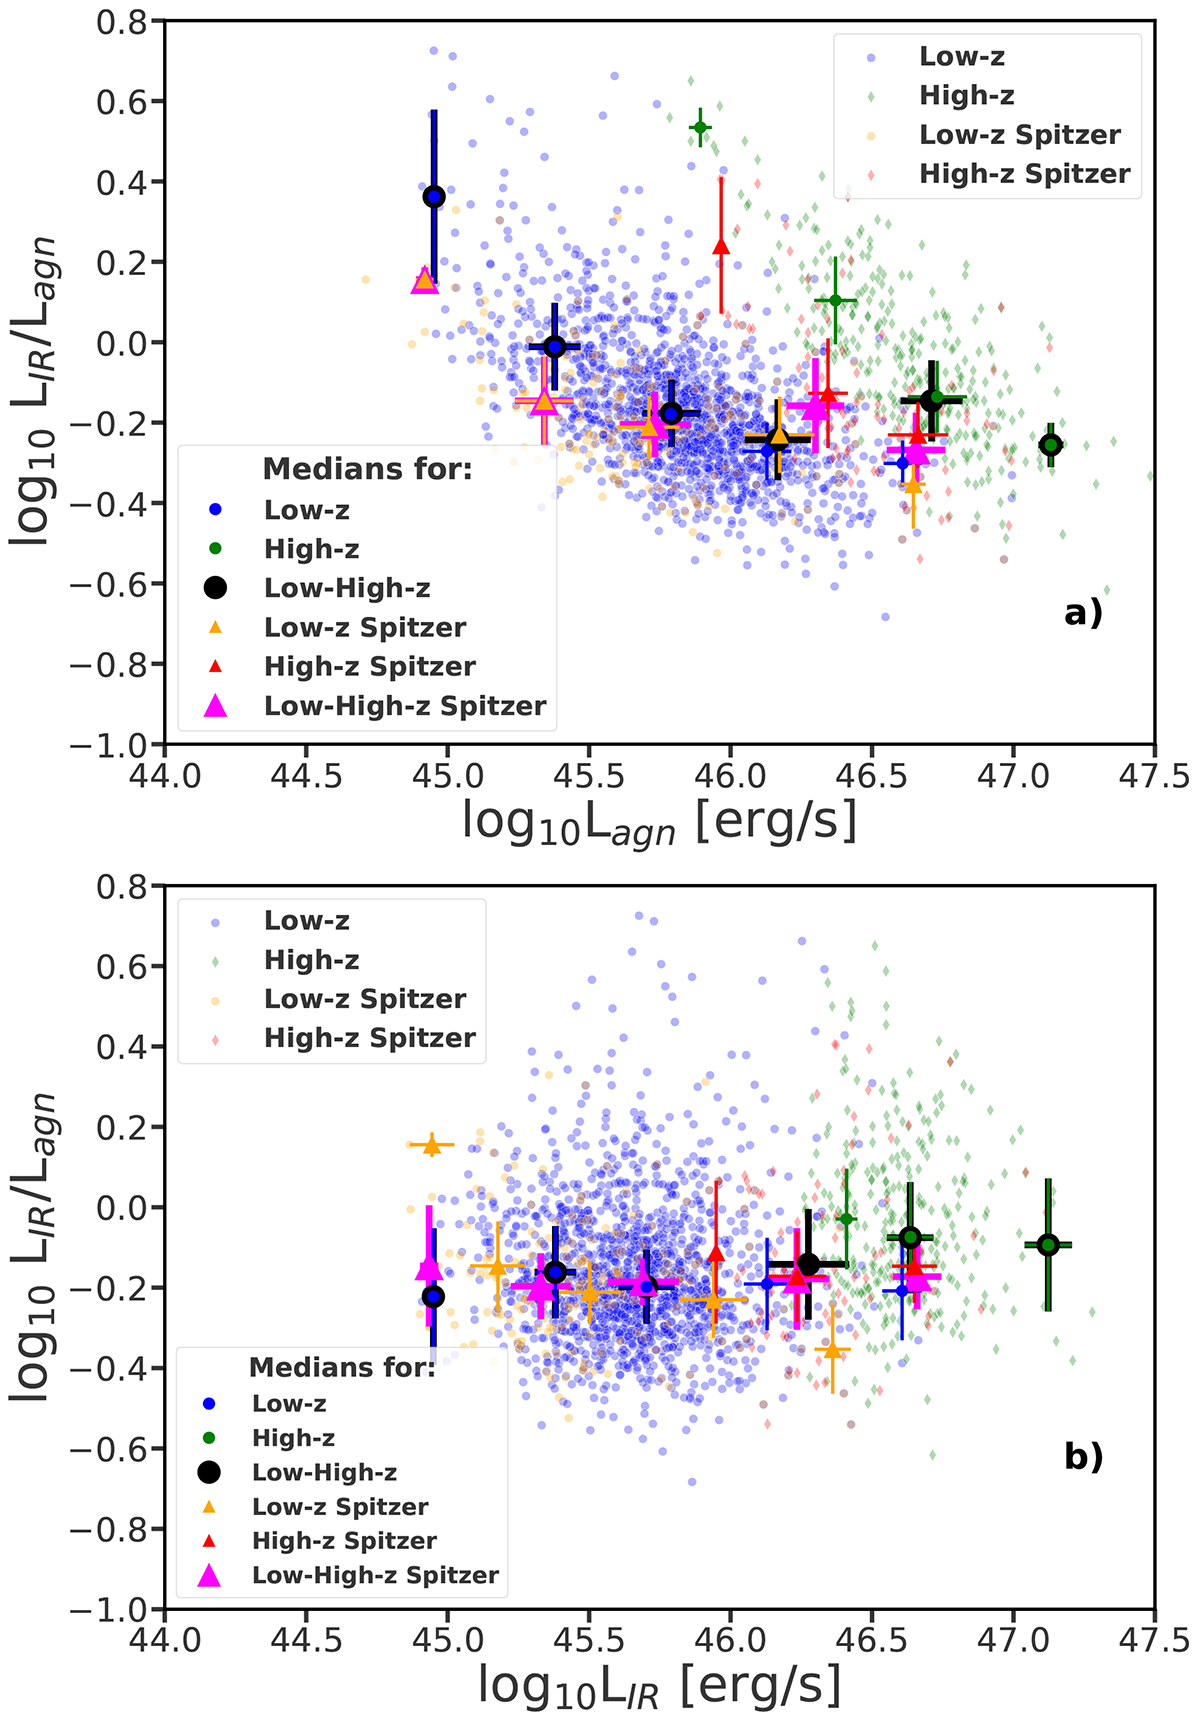
Fig. 6.
Download original image
Relationships between CF and LIR (upper panel a) and Lagn (lower panel b), including only the sources with S/NW3 & W4 > 5. The blue circles indicate low-z quasars, and the green and red diamonds indicate high-z sources. The orange circles and red diamonds indicate low-z and high-z quasars with the Spitzer M24 data. Additionally, the median statistics were calculated for the samples, as described in the legend in the lower left corner. The error bars represent the MAD errors.
Current usage metrics show cumulative count of Article Views (full-text article views including HTML views, PDF and ePub downloads, according to the available data) and Abstracts Views on Vision4Press platform.
Data correspond to usage on the plateform after 2015. The current usage metrics is available 48-96 hours after online publication and is updated daily on week days.
Initial download of the metrics may take a while.