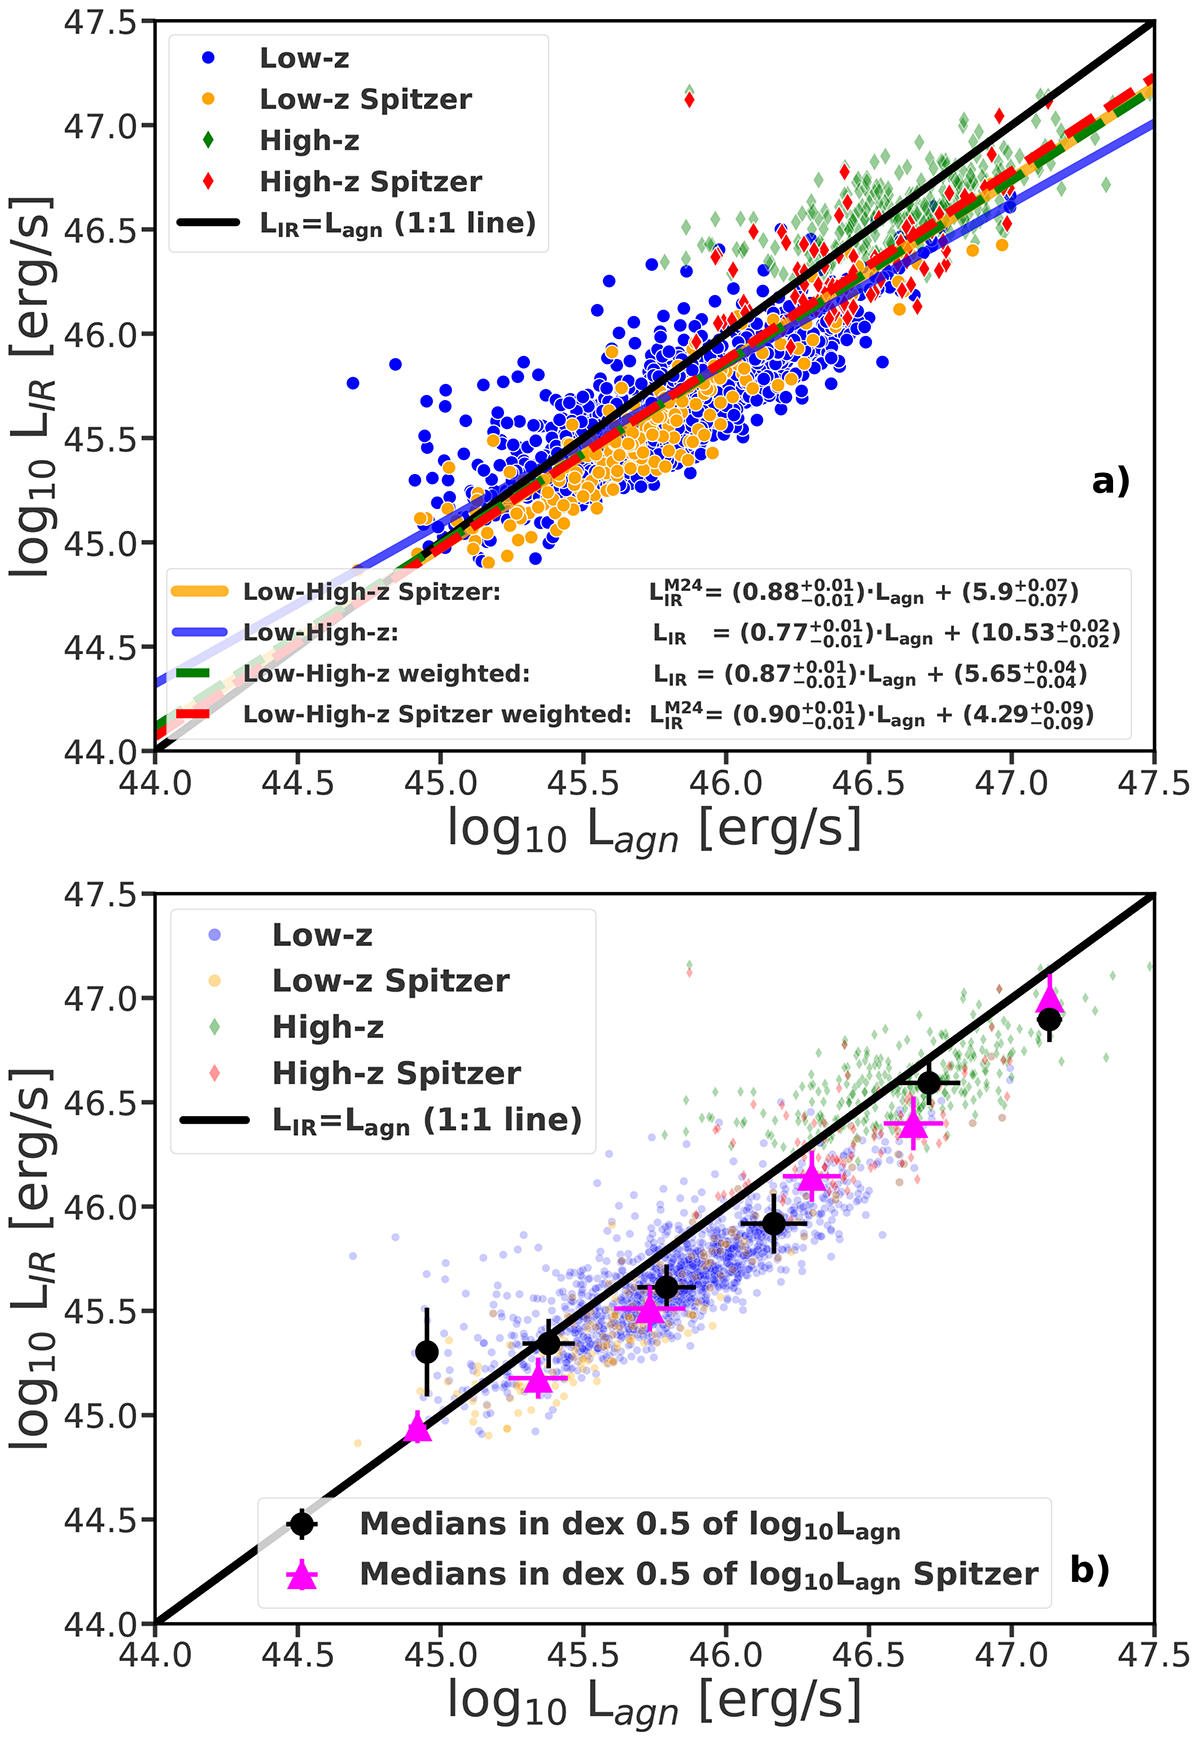
Fig. 3.
Download original image
Relation between log LIR and log Lagn with S/NW3 & W4 > 5. The blue and orange circles indicate low-z quasars, whereas the green and red diamonds indicate high-z sources. The orange circles and red diamonds indicate low-z and high-z quasars with Spitzer M24 data. In panel a the blue line denotes the best-fit Bayesian regression for the low-high-z data with S/NW3 & W4 > 5, the orange line is the Bayesian regression for the low-high-zSpitzer data from both low-z and high-z, and the green and red dashed lines represent the best Bayesian fit with the low-z sample weighted and low-z with Spitzer weighted, respectively; the black line gives the 1:1 scaling relation between LIR and Lagn. In panel b the big black circles represent the medians calculated for the 0.5 dex in log Lagn for both redshift samples (low-high-z) and the orange big triangles stand for the medians calculated for both redshift samples with the Spitzer data (low-high-zSpitzer). For the black and the magenta points, the error bars represent MAD. The exact values of the fitted parameters are listed in Table 1.
Current usage metrics show cumulative count of Article Views (full-text article views including HTML views, PDF and ePub downloads, according to the available data) and Abstracts Views on Vision4Press platform.
Data correspond to usage on the plateform after 2015. The current usage metrics is available 48-96 hours after online publication and is updated daily on week days.
Initial download of the metrics may take a while.