Fig. E.3.
Download original image
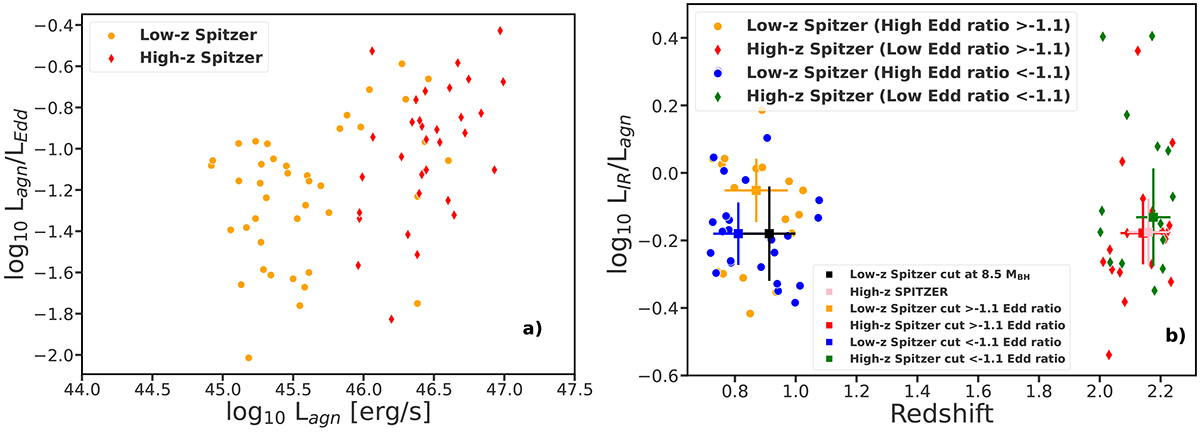
Spitzer data after the S/NW3 > 5, but without the cross-match with VAC. The cut was performed in log LIR/Lagn = −1.1 and two subsamples were created, for Low-z and High-z. The right panel presents the CF distribution for the truncated sample. The black and pink points represent medians for the MBH cut with MAD errors. The orange and red points represent the medians and MAD errors for the low and high sample with the Eddington ratio exceeding −1.1, while the blue and green points represents the samples with the Eddington ratio below −1.1. The samples are comparable within the errors.
Current usage metrics show cumulative count of Article Views (full-text article views including HTML views, PDF and ePub downloads, according to the available data) and Abstracts Views on Vision4Press platform.
Data correspond to usage on the plateform after 2015. The current usage metrics is available 48-96 hours after online publication and is updated daily on week days.
Initial download of the metrics may take a while.