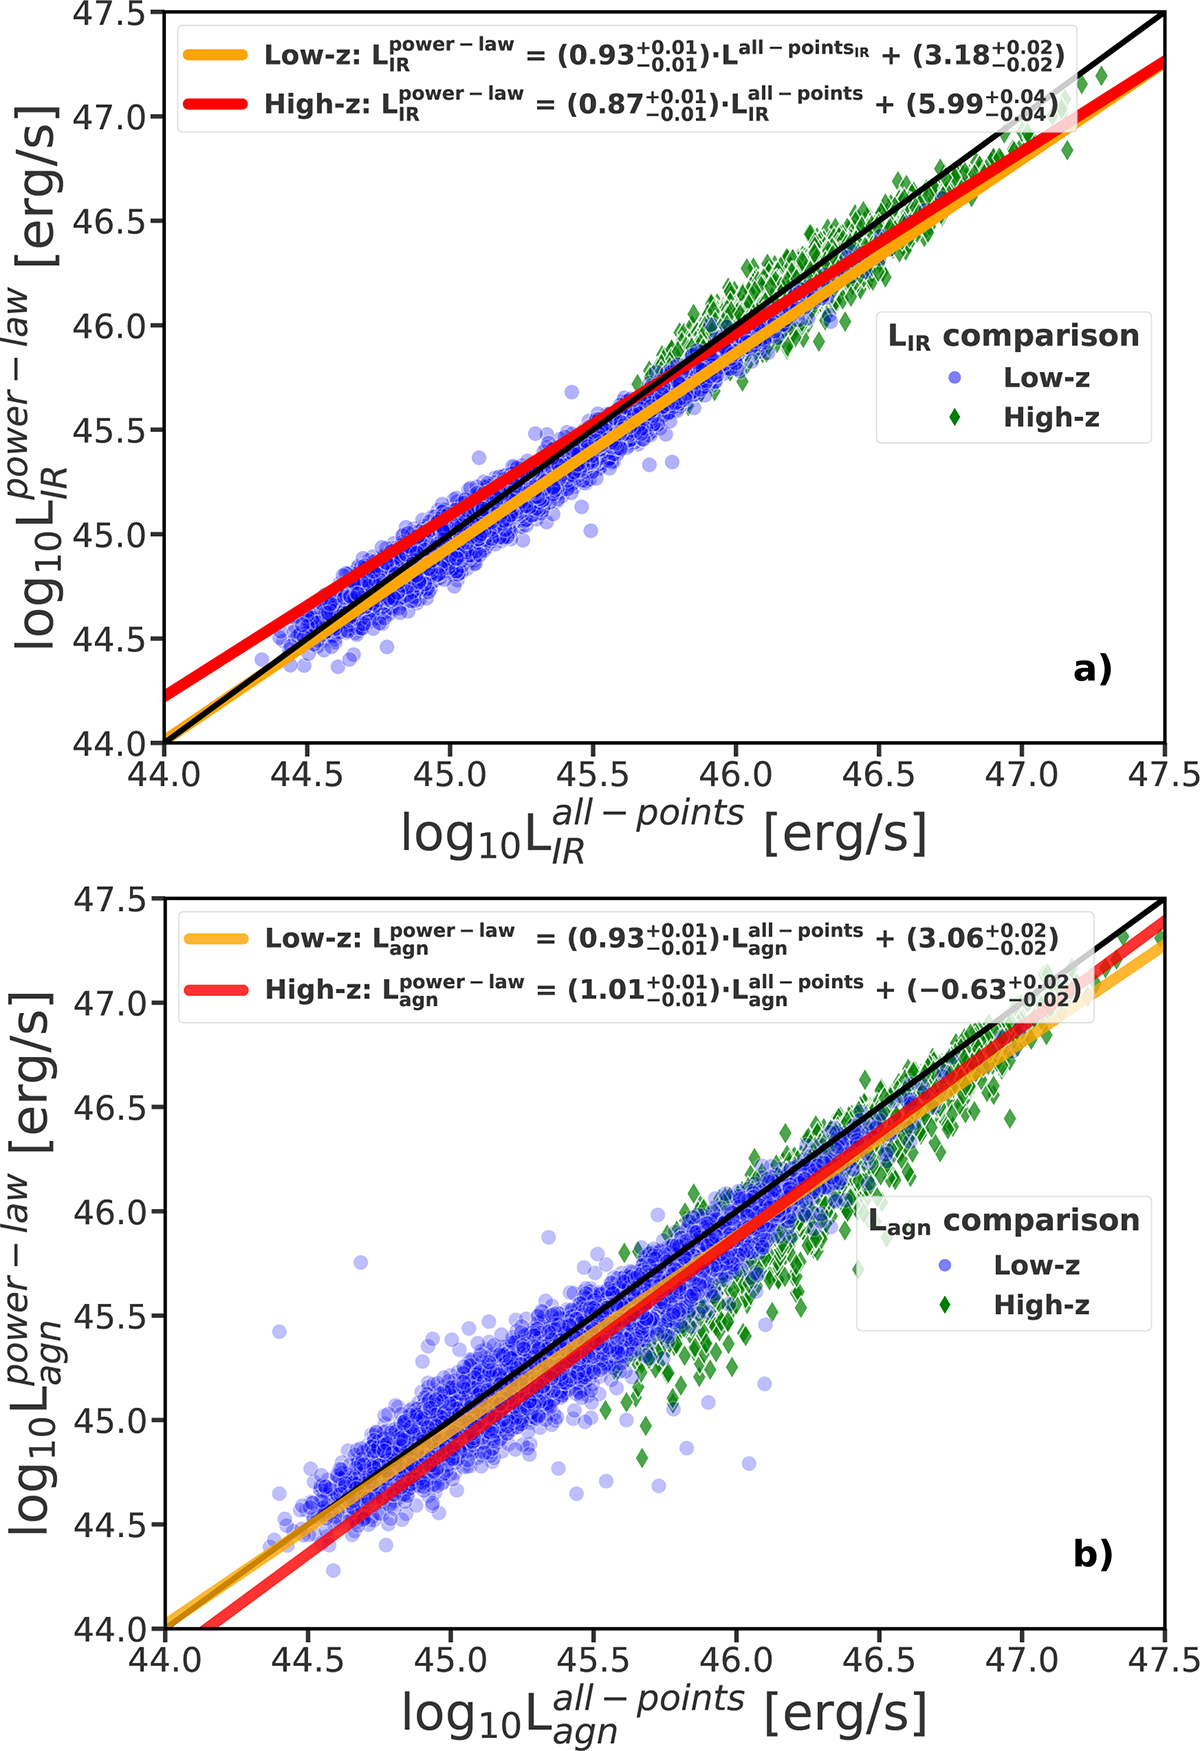
Fig. D.2.
Download original image
Comparison between luminosities based on the power-law (Y-axis) and all-points (X-axis) methods of integration. The upper panel shows the comparison between LIR, and the lower panel panel between Lagn. The black line stands for the 1:1 relation. In both panels, the blue circles and green diamonds denote the Low-z and High-z quasars, respectively. The red and orange lines represent the best Bayesian regression fit, with the best-fit relation given in each panel.
Current usage metrics show cumulative count of Article Views (full-text article views including HTML views, PDF and ePub downloads, according to the available data) and Abstracts Views on Vision4Press platform.
Data correspond to usage on the plateform after 2015. The current usage metrics is available 48-96 hours after online publication and is updated daily on week days.
Initial download of the metrics may take a while.