Open Access
Fig. B.1.
Download original image
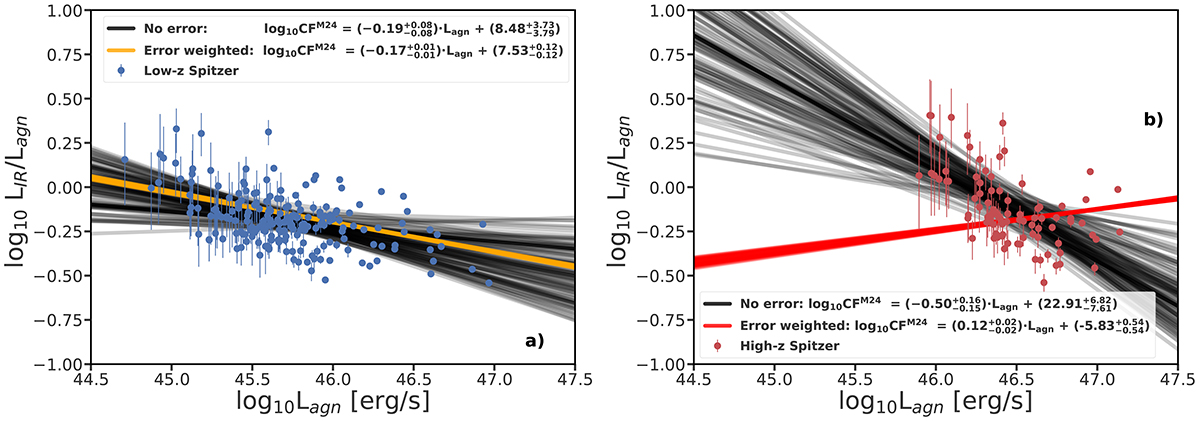
Comparison of two different likelihoods in Bayesian fitting methods for Spitzer data between log CF vs log Lagn for a) Low-z sources and b) High-z sources. The orange and red lines represent the same Bayesian fitting as in Figure 10, while the black lines represent the fitting based on the likelihood without error weights.
Current usage metrics show cumulative count of Article Views (full-text article views including HTML views, PDF and ePub downloads, according to the available data) and Abstracts Views on Vision4Press platform.
Data correspond to usage on the plateform after 2015. The current usage metrics is available 48-96 hours after online publication and is updated daily on week days.
Initial download of the metrics may take a while.