Open Access
Fig. A.1.
Download original image
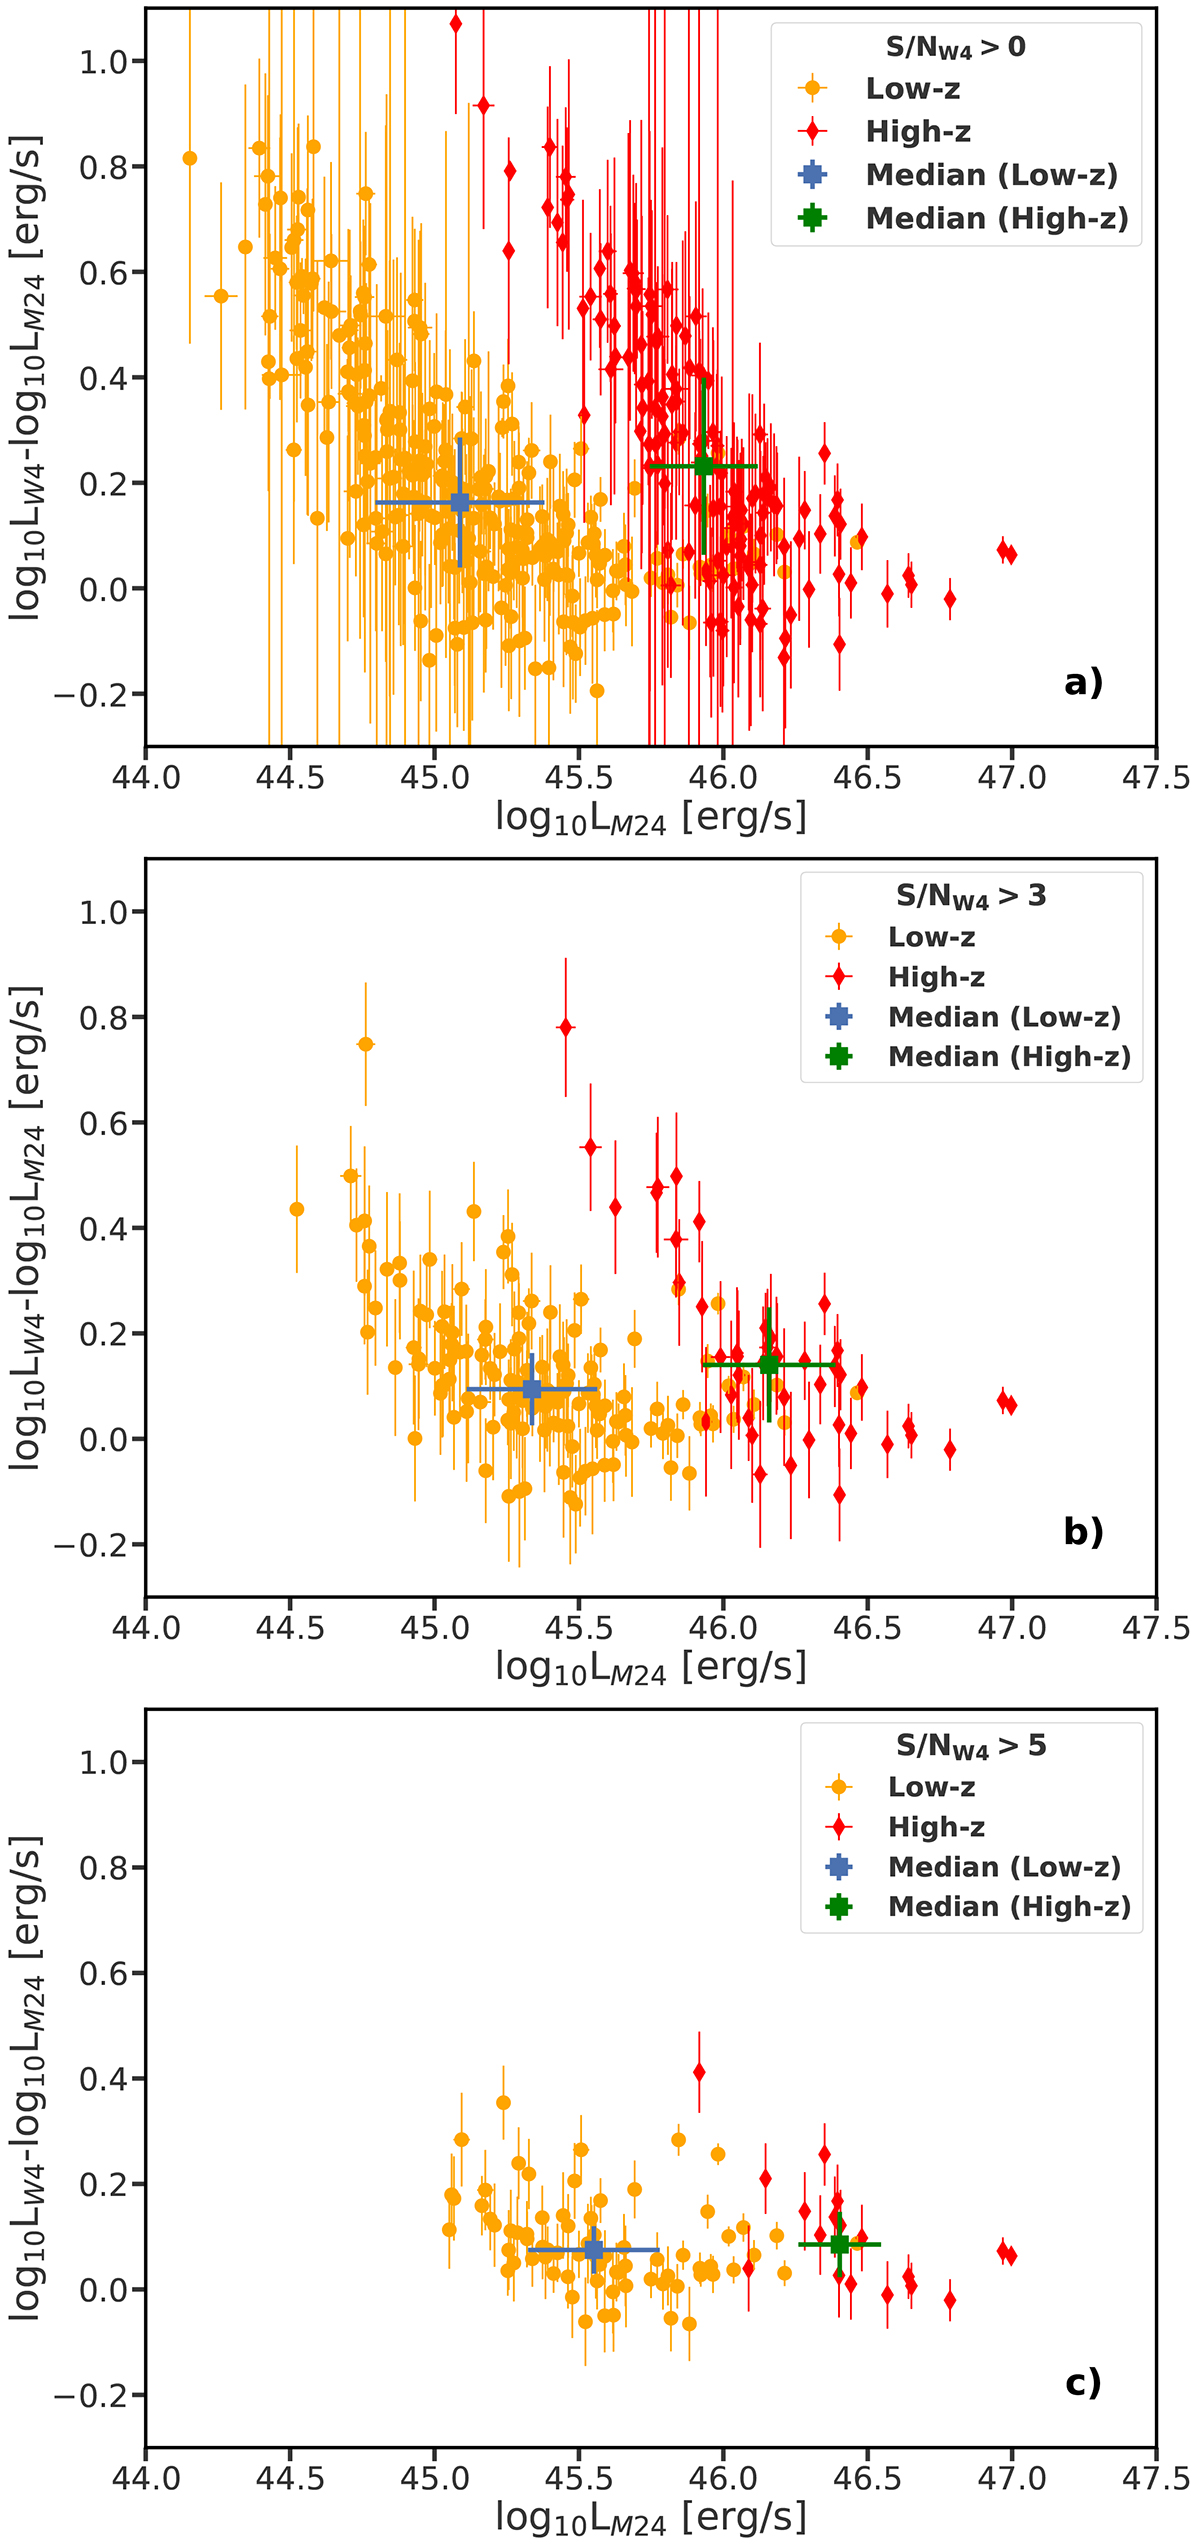
Comparison of data quality for the M24 and W4 with different restrictions on S/NW4. The panels present (from top to bottom) log LW4 − log LM24 vs log LM24 with S/NW4 > 0, > 3, and > 5. The orange circles indicate the Low-z quasars; the red diamonds are the High-z sources.
Current usage metrics show cumulative count of Article Views (full-text article views including HTML views, PDF and ePub downloads, according to the available data) and Abstracts Views on Vision4Press platform.
Data correspond to usage on the plateform after 2015. The current usage metrics is available 48-96 hours after online publication and is updated daily on week days.
Initial download of the metrics may take a while.