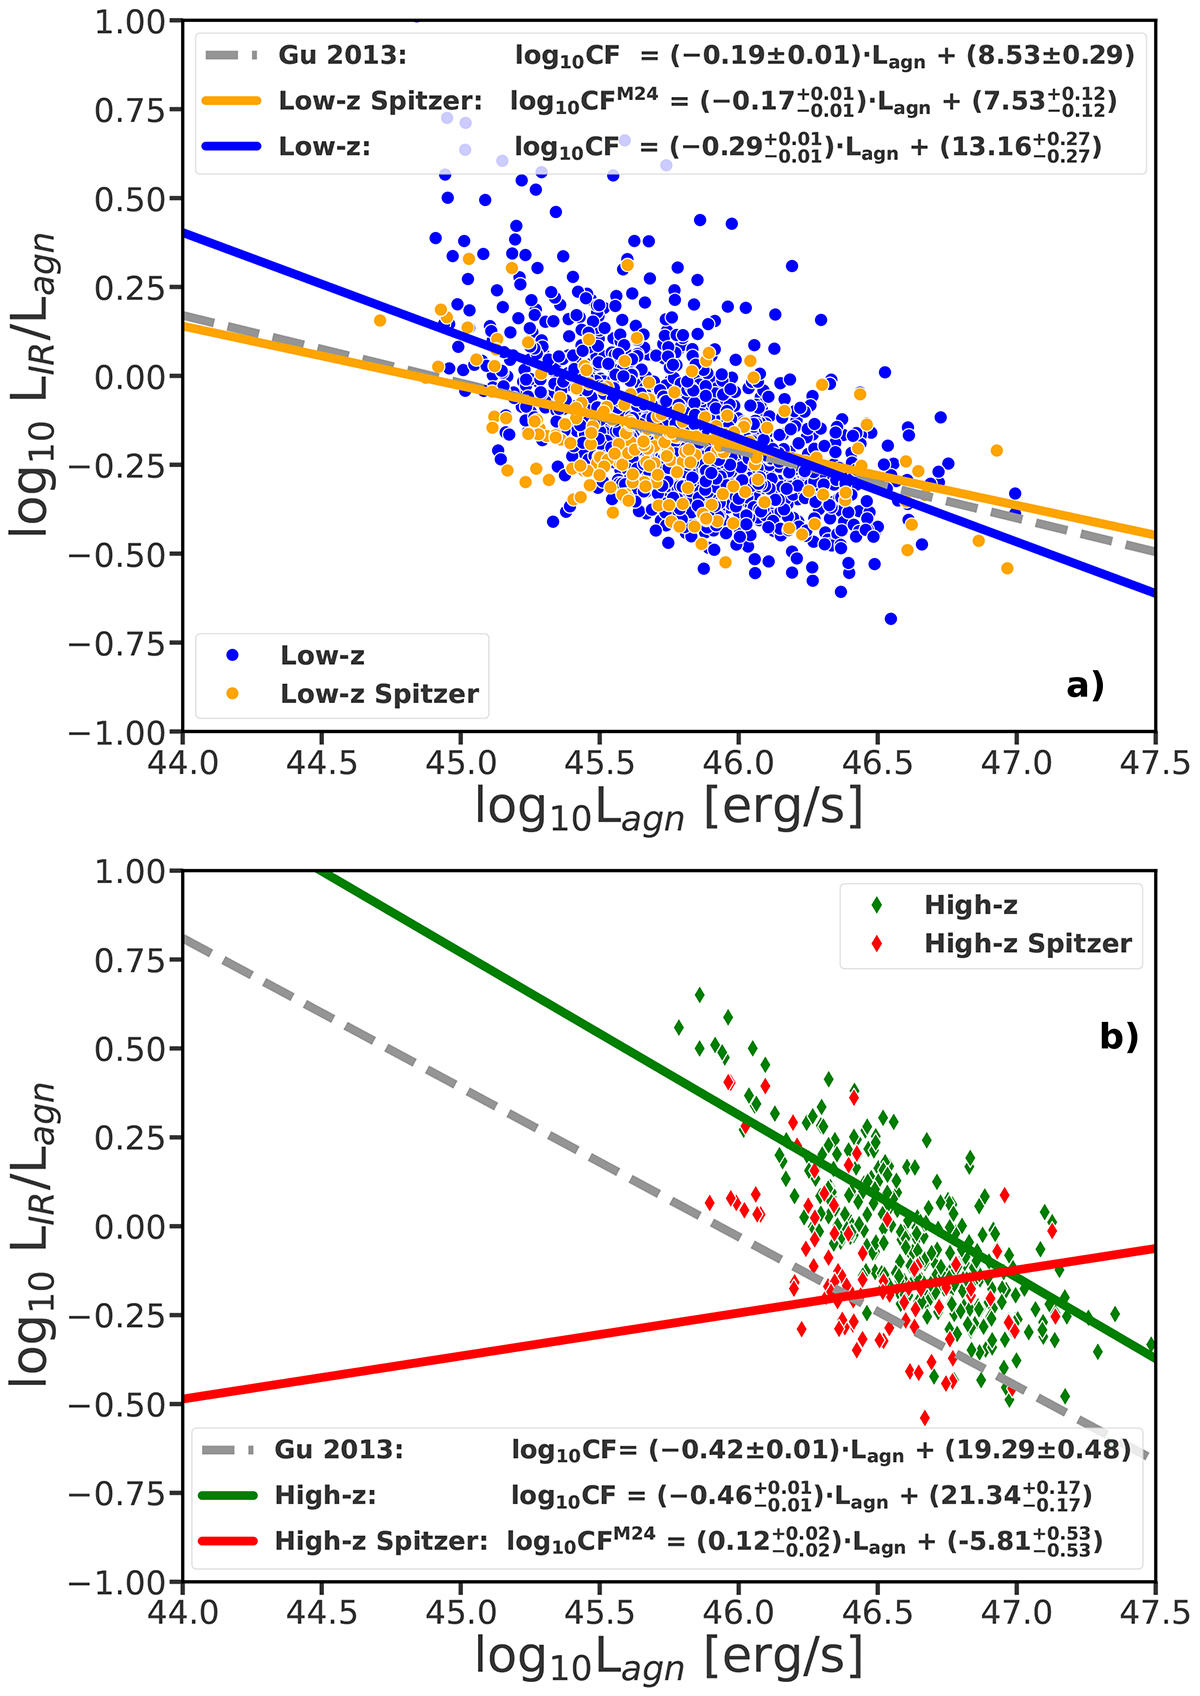
Fig. 10.
Download original image
Relation between log CF and log Lagn for the low-z and high-z sources with S/NW3 & W4 > 5 (upper and lower panels, respectively). The regression lines in both panels fitted to our various subsamples, with and without the Spitzer data, along with the Gu (2013) regression lines for comparison, are described in the legends of the two panels.
Current usage metrics show cumulative count of Article Views (full-text article views including HTML views, PDF and ePub downloads, according to the available data) and Abstracts Views on Vision4Press platform.
Data correspond to usage on the plateform after 2015. The current usage metrics is available 48-96 hours after online publication and is updated daily on week days.
Initial download of the metrics may take a while.