Fig. 2.
Download original image
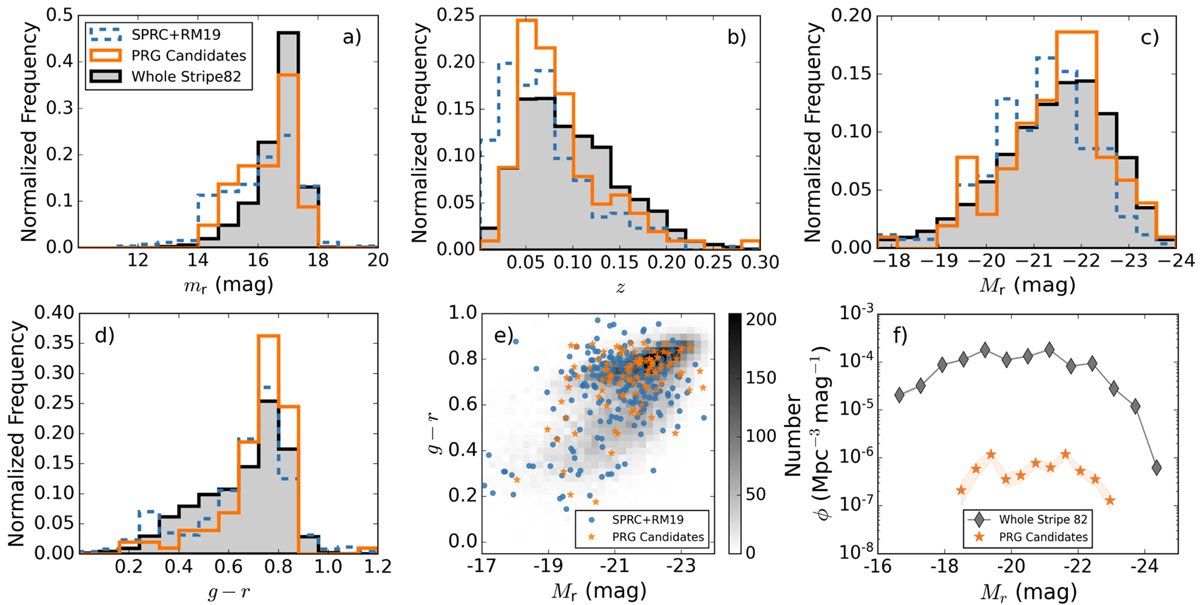
Normalized histograms comparing a) apparent magnitude in the r band, b) redshift z, c) absolute magnitude in the r band, and d) galaxy colour g − r. The black filled histograms represent the entire Stripe 82 sample, while the SPRC+RM19 (see text) and our new candidates are shown as blue dashed and orange solid histograms, respectively. Plot e): a colour-magnitude diagram (the underlying density plot depicts the distribution of the entire Stripe 82 sample of the 18 362 galaxies). All magnitudes have been corrected for K-correction (Chilingarian et al. 2010; Chilingarian & Zolotukhin 2012) and Galactic extinction using the conversions from Schlafly & Finkbeiner (2011) applied to E(B − V) from Schlegel et al. (1998). Plot f): luminosity functions of our new PRG sample and the entire Stripe 82 sample calculated with Chołoniewski’s method (Choloniewski 1986).
Current usage metrics show cumulative count of Article Views (full-text article views including HTML views, PDF and ePub downloads, according to the available data) and Abstracts Views on Vision4Press platform.
Data correspond to usage on the plateform after 2015. The current usage metrics is available 48-96 hours after online publication and is updated daily on week days.
Initial download of the metrics may take a while.