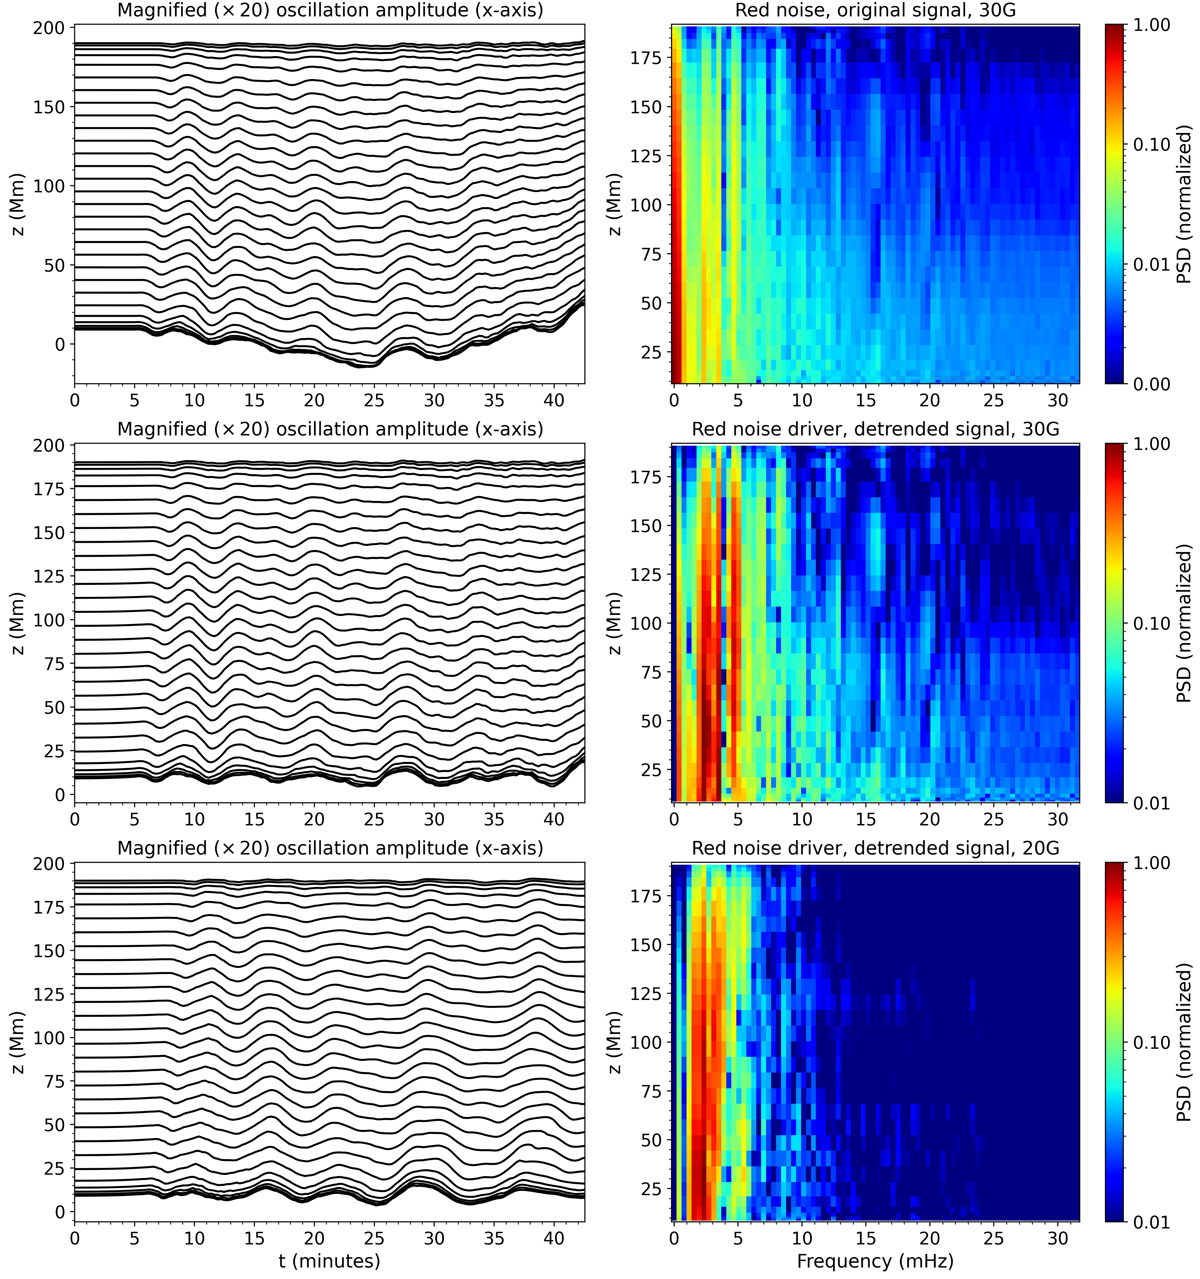
Fig. 3.
Download original image
Centre of mass x displacement and corresponding spectra for two different loops. Left panels: magnified (×20) x displacement of the loop centre of mass per height (projected on z) from slits placed along the coronal part of the loop. Right panels: fourier power spectra of the displacement taken from the slits on the left. The top and middle panels correspond to the original and detrended displacement signals for a loop with a coronal magnetic field Bz ∼ 30 G. The bottom panels correspond to the detrended displacement signal for a loop with Bz ∼ 20 G.
Current usage metrics show cumulative count of Article Views (full-text article views including HTML views, PDF and ePub downloads, according to the available data) and Abstracts Views on Vision4Press platform.
Data correspond to usage on the plateform after 2015. The current usage metrics is available 48-96 hours after online publication and is updated daily on week days.
Initial download of the metrics may take a while.