Fig. A.1.
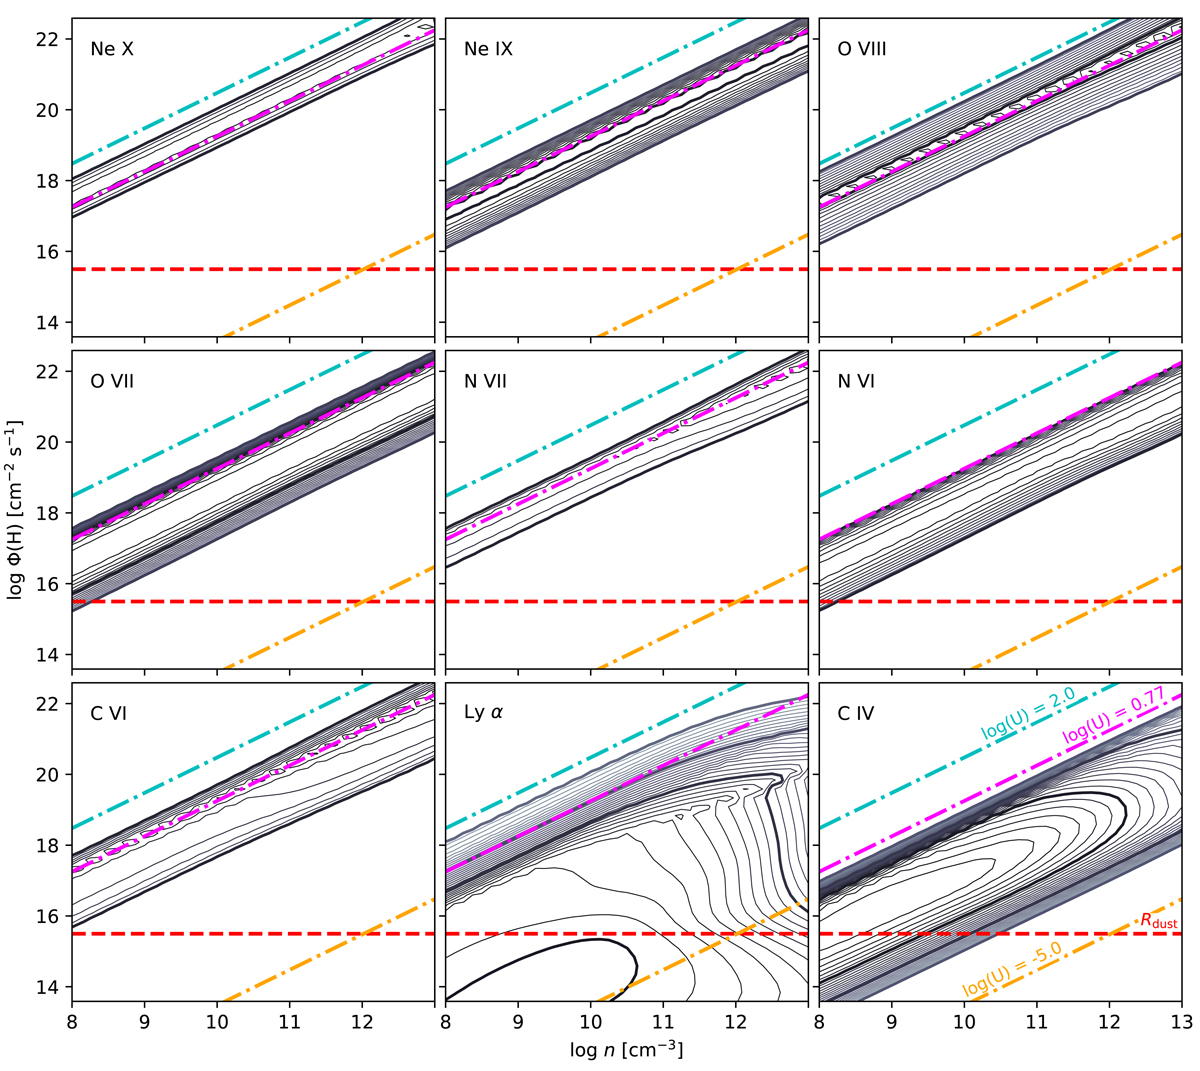
Download original image
Predicted line emission of the X-ray lines well-detected in Mrk 110, C IV, and Lyα, plotted as a function of the hydrogen-ionising photon flux and the gas density. The contours present the logarithmic line equivalent widths, referenced to the incident continuum at 1216 Å and unity covering fraction. The contours plotted as thick solid lines correspond to 1 dex steps, starting with the smallest visualised value of 1 Å. The thin lines, separated with steps of 0.1 dex, provide further details of the inwards increase in the emission within the typically rather narrow portions of the parameter space. The coloured lines are defined in the bottom-right box and are explained in Sect. 3.2.
Current usage metrics show cumulative count of Article Views (full-text article views including HTML views, PDF and ePub downloads, according to the available data) and Abstracts Views on Vision4Press platform.
Data correspond to usage on the plateform after 2015. The current usage metrics is available 48-96 hours after online publication and is updated daily on week days.
Initial download of the metrics may take a while.