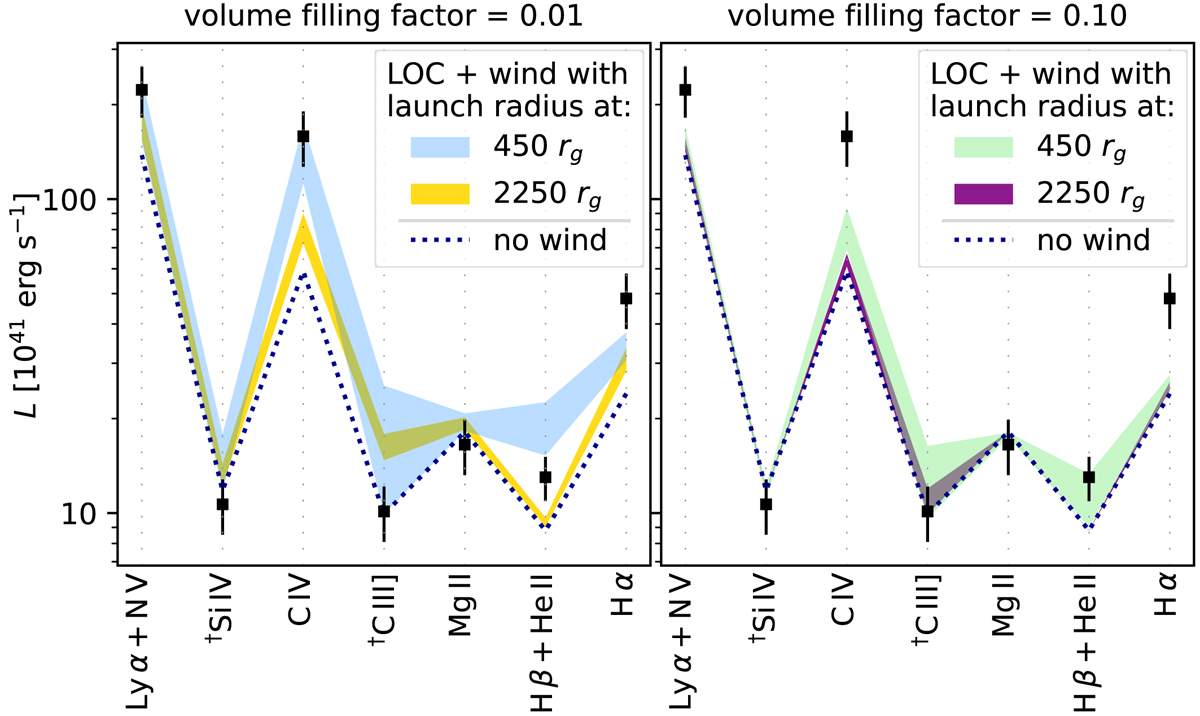
Fig. 8.
Download original image
Sum of the best-fitting LOC model (dotted lines) and the predictions from wind-like BLR models of Matthews et al. (2020) (shaded areas). The wind volume-filling factor of the displayed models is 0.01 (left panel) and 0.1 (right panel). The width of the composite model prediction for each line represents the range of luminosity expected by the wind model assuming different minimal and maximal opening angles of the wind, ranging from nearly axial to nearly equatorial. Following the wind model predictions, we merged the measured luminosities of Lyα with those of N V, and the measured luminosities of Hβ with those of He II, in addition to other blends (same as in Fig. 4, marked with a dagger).
Current usage metrics show cumulative count of Article Views (full-text article views including HTML views, PDF and ePub downloads, according to the available data) and Abstracts Views on Vision4Press platform.
Data correspond to usage on the plateform after 2015. The current usage metrics is available 48-96 hours after online publication and is updated daily on week days.
Initial download of the metrics may take a while.