Fig. 6.
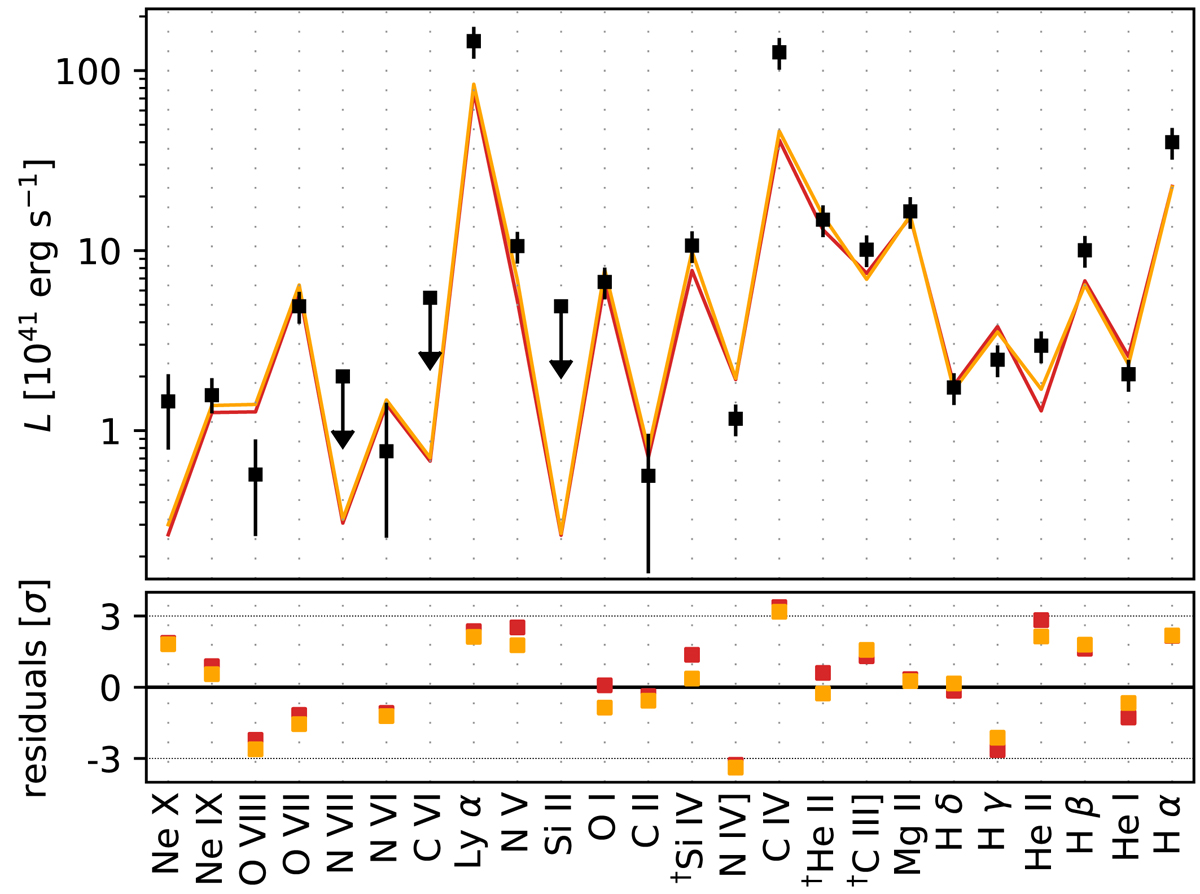
Download original image
Luminosities of the X-ray, UV, and optical lines fitted with LOC models. Top: best-fitting single-component LOC model with the radial distribution power-law index γ considered as a free parameter in the fit (orange; see Sect. 3.3.4 for details). Bottom: corresponding fit residuals in units of the uncertainty σ of the line luminosity measurements. The baseline model (with the radial distribution power-law index fixed to γ = −1; see Sect. 3.3.1 and Fig. 4) and the corresponding residuals (red) are displayed for reference. The data are displayed as in Fig. 4.
Current usage metrics show cumulative count of Article Views (full-text article views including HTML views, PDF and ePub downloads, according to the available data) and Abstracts Views on Vision4Press platform.
Data correspond to usage on the plateform after 2015. The current usage metrics is available 48-96 hours after online publication and is updated daily on week days.
Initial download of the metrics may take a while.