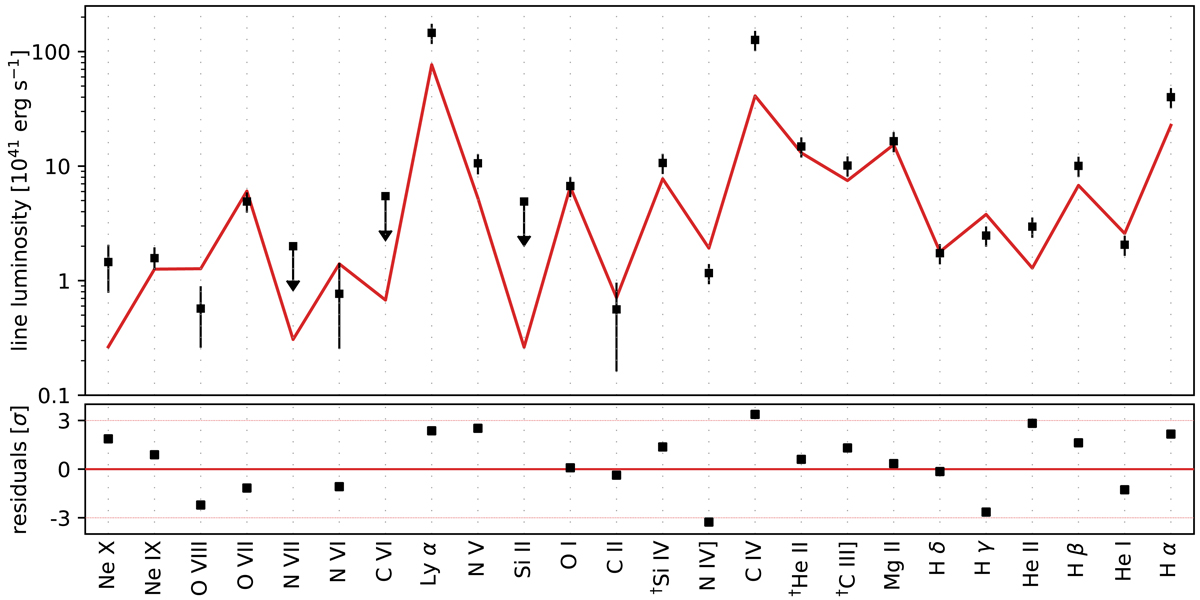
Fig. 4.
Download original image
Luminosities of the X-ray, UV, and optical lines and the best-fitting baseline LOC model. The data points displayed in the upper panel represent the intermediate+broad components of the observed line luminosities corrected for Galactic extinction and ordered by wavelength (increasing to the right). The spectral lines labelled with a dagger, namely Si IV, He II, and CIII], represent summed luminosities from blended nearby lines, as explained in Table 3. The upper limits were not taken into consideration during fitting and are only plotted for reference. In the bottom panel, the fit residuals for both models are plotted for comparison.
Current usage metrics show cumulative count of Article Views (full-text article views including HTML views, PDF and ePub downloads, according to the available data) and Abstracts Views on Vision4Press platform.
Data correspond to usage on the plateform after 2015. The current usage metrics is available 48-96 hours after online publication and is updated daily on week days.
Initial download of the metrics may take a while.