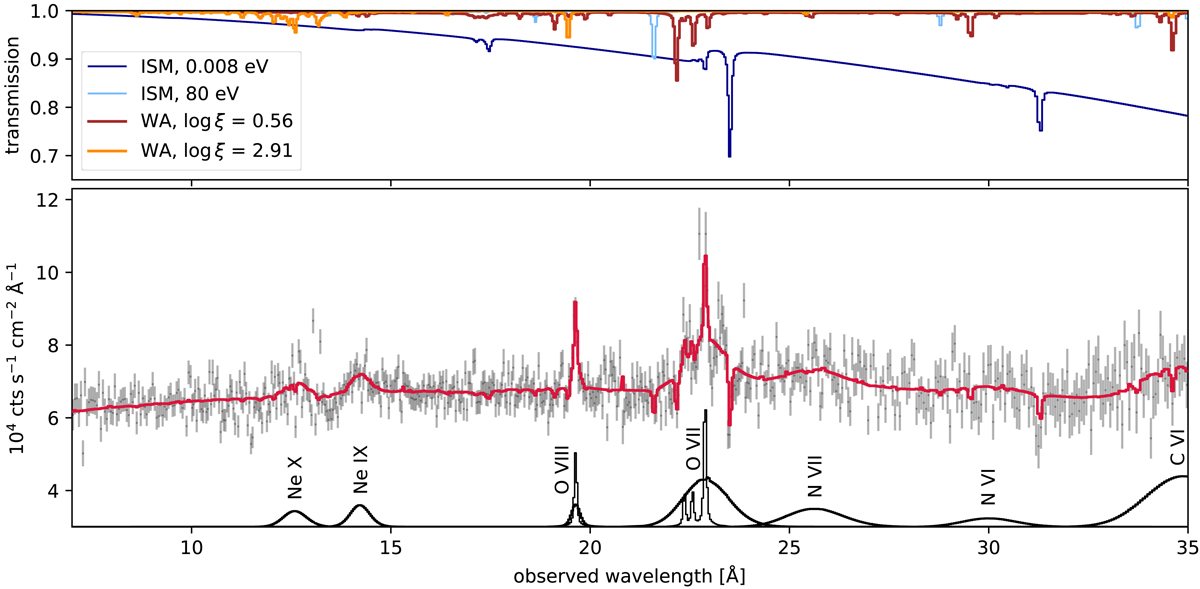
Fig. 1.
Download original image
Fit of the RGS spectrum of Mrk 110. Bottom panel: observed spectrum is overlaid with the best-fitting model (C-stat. = 1038 for 900 deg of freedom, red line). The individual emission line components of the model are plotted in black at the bottom of this panel (with a vertical offset of 3 for visualisation purposes). The data were rebinned for clarity. Top panel: transmissivity of the absorbing components: galactic absorption (dark and light blue) and ionised absorbers in Mrk 110 with log ξ = 0.56 (brown), log ξ = 2.91 (orange).
Current usage metrics show cumulative count of Article Views (full-text article views including HTML views, PDF and ePub downloads, according to the available data) and Abstracts Views on Vision4Press platform.
Data correspond to usage on the plateform after 2015. The current usage metrics is available 48-96 hours after online publication and is updated daily on week days.
Initial download of the metrics may take a while.