Fig. 7
Download original image
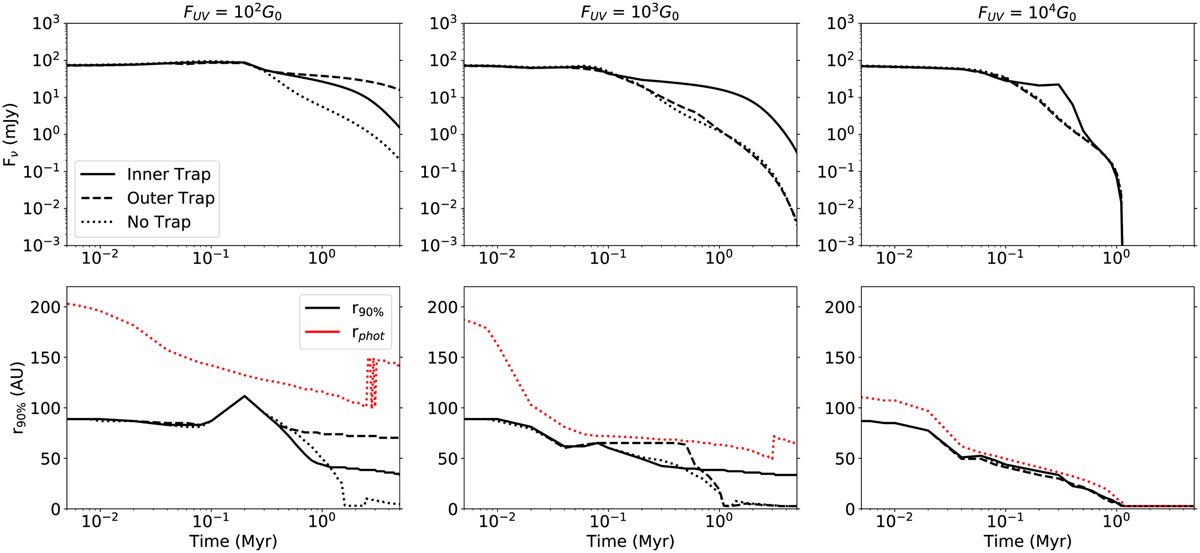
Evolution of the disk observables, for different FUV fields and trap locations (1 /3rc, 2/3rc or none). Top: evolution disk flux in the 1.3 mm continuum at a distance of 400 pc. Bottom: time evolution of the r90% enclosing 90% (black) of the disk emission in the continuum above the sensitivity limit (0.1 mJy beam-1), and the photoevaporative radius derived from the FRIED grid mass loss profile (red dotted lines, see Sellek et al. 2020). We note that towards the end of the simulation the calculation of the photoevaporative radius suffers from numerical effects due to the discrete nature of the FRIED grid.
Current usage metrics show cumulative count of Article Views (full-text article views including HTML views, PDF and ePub downloads, according to the available data) and Abstracts Views on Vision4Press platform.
Data correspond to usage on the plateform after 2015. The current usage metrics is available 48-96 hours after online publication and is updated daily on week days.
Initial download of the metrics may take a while.