Fig. 4
Download original image
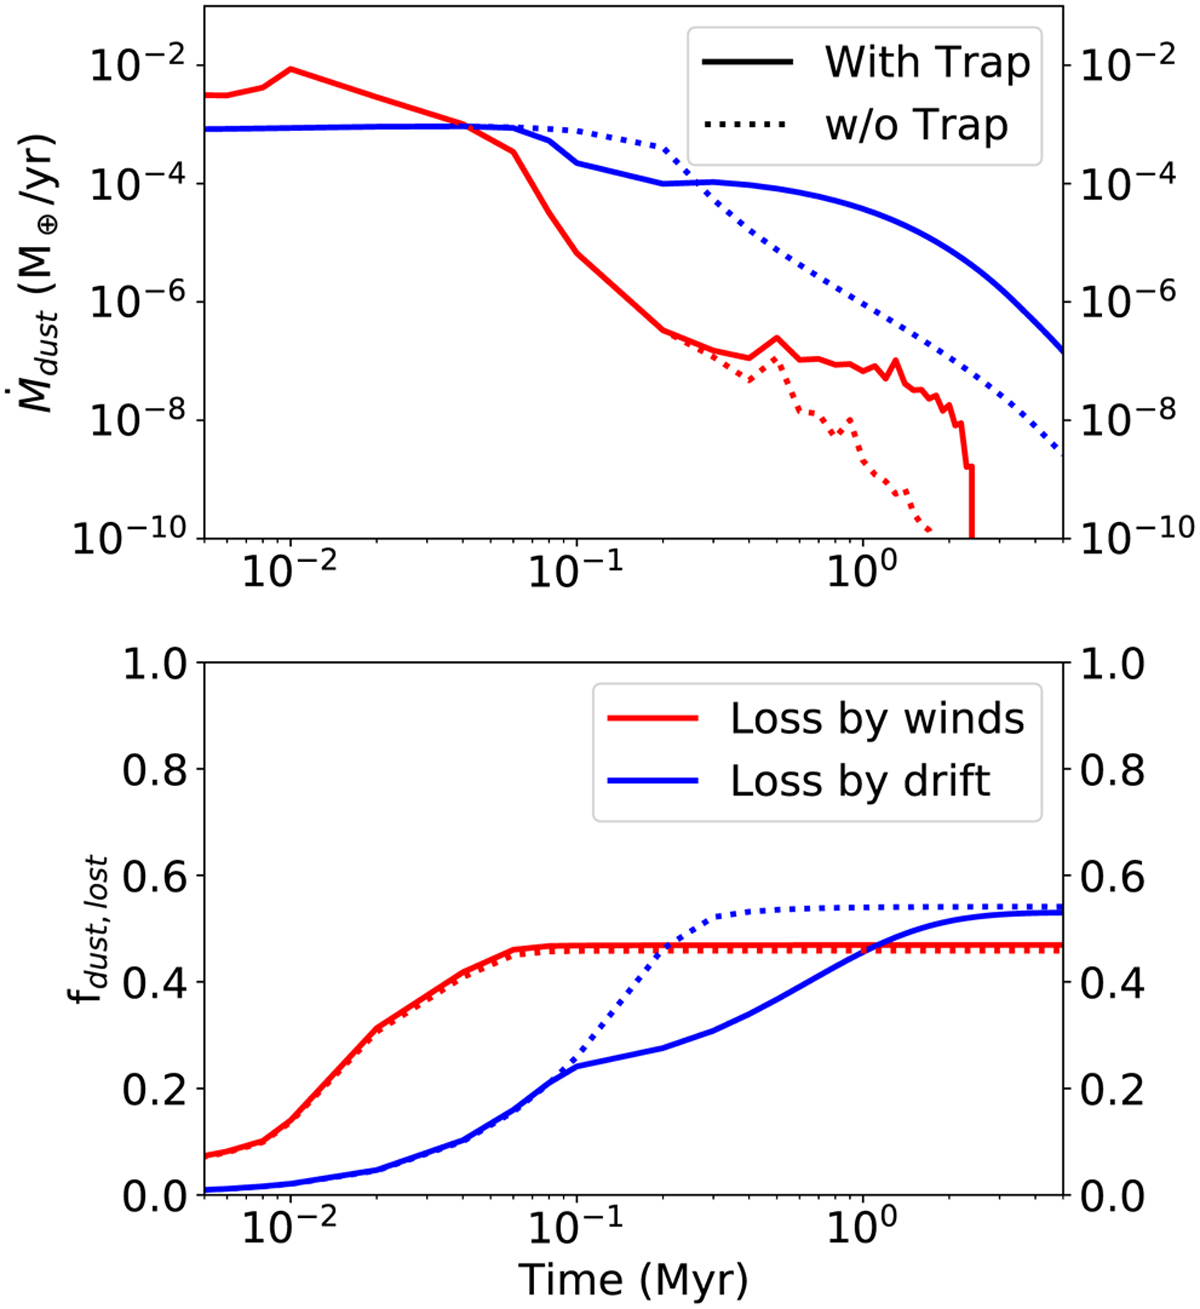
Evolution of the dust mass loss over time for a photoevaporating disk with FUV = 103 G0. Top: evolution of the dust loss rate with and without dust traps (solid vs. dotted lines). The figure shows the distinction between the dust loss rate due to drift into the star (red), and due to entrainment with the photoevaporative wind (blue). Bottom: cumulative fraction of dust lost (relative to the initial dust mass) due to winds and drift.
Current usage metrics show cumulative count of Article Views (full-text article views including HTML views, PDF and ePub downloads, according to the available data) and Abstracts Views on Vision4Press platform.
Data correspond to usage on the plateform after 2015. The current usage metrics is available 48-96 hours after online publication and is updated daily on week days.
Initial download of the metrics may take a while.