Fig. 3
Download original image
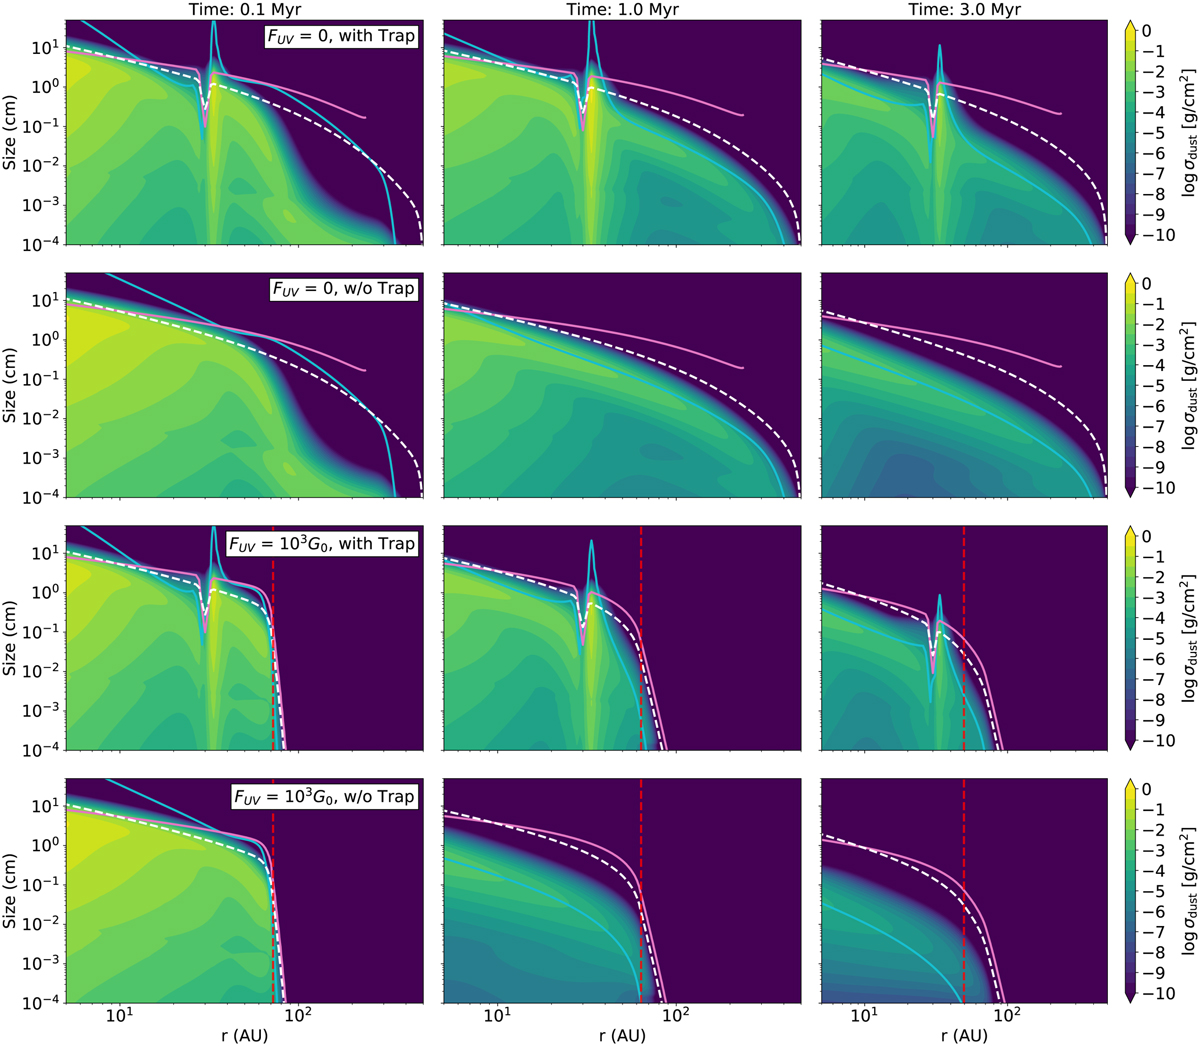
Dust size distribution at 0.1, 1, and 3 Myr (from left to right), for the simulations with/without photoevaporation, and with/without dust traps. The solid lines indicate the estimated fragmentation and drift growth limits (magenta and cyan, respectively). For reference, we show the grain sizes that correspond to St = 0.1 with a dashed white line, and the photoevaporation radius with a dashed red line. Note that we plot σdust, which has surface density units, but it is normalized by the logarithmic bin size (see Birnstiel et al. 2010).
Current usage metrics show cumulative count of Article Views (full-text article views including HTML views, PDF and ePub downloads, according to the available data) and Abstracts Views on Vision4Press platform.
Data correspond to usage on the plateform after 2015. The current usage metrics is available 48-96 hours after online publication and is updated daily on week days.
Initial download of the metrics may take a while.