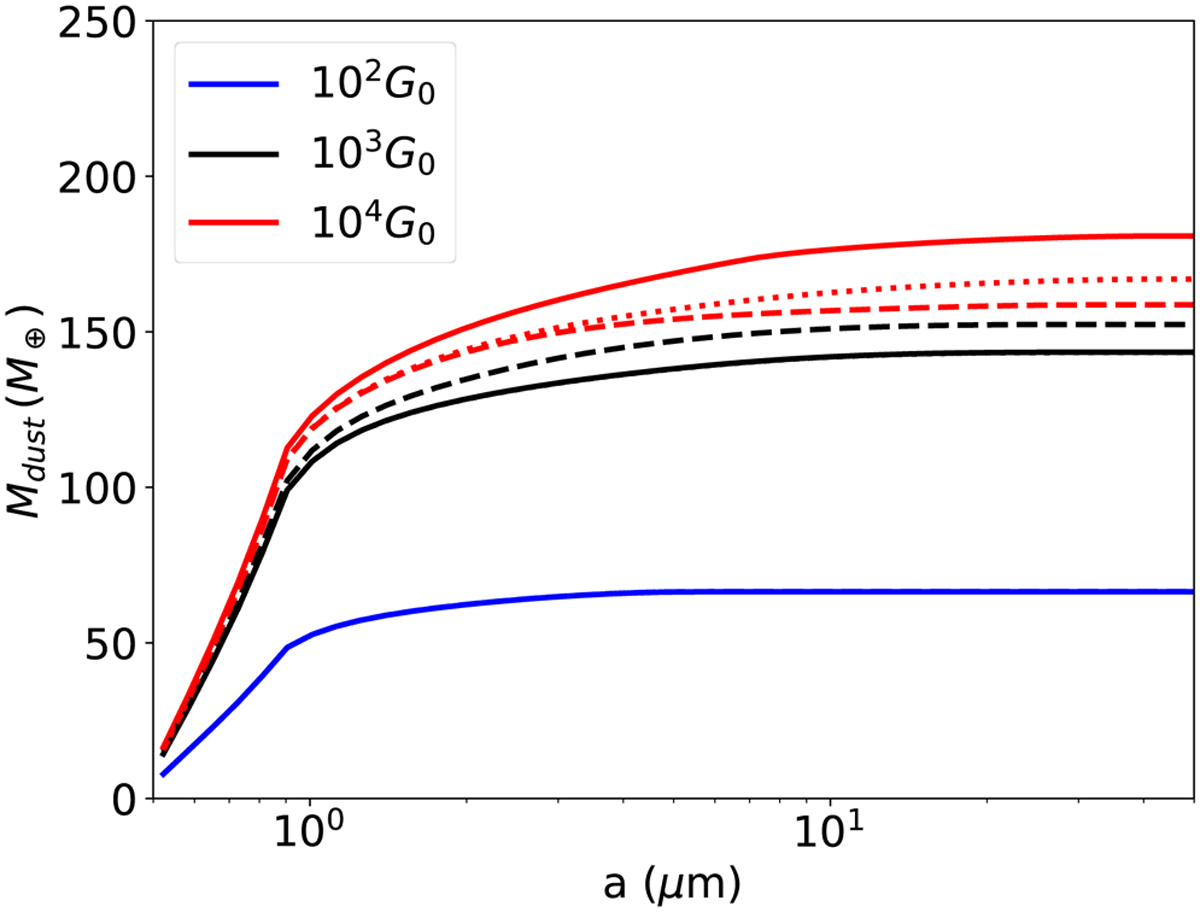
Fig. 14
Download original image
Cumulative size distribution of the dust grains lost up to a time of 1 Myr for the simulations shown in Sect. 4.2, for the different UV fluxes, and trap properties. The line styles represent the disks with an inner trap, an outer trap, and no traps at all (solid, dashed, and dotted lines respectively). For the disks with low irradiation environments (102 G0) the dust traps have no effect on the lost dust distribution and the three lines overlap.
Current usage metrics show cumulative count of Article Views (full-text article views including HTML views, PDF and ePub downloads, according to the available data) and Abstracts Views on Vision4Press platform.
Data correspond to usage on the plateform after 2015. The current usage metrics is available 48-96 hours after online publication and is updated daily on week days.
Initial download of the metrics may take a while.