Fig. 1
Download original image
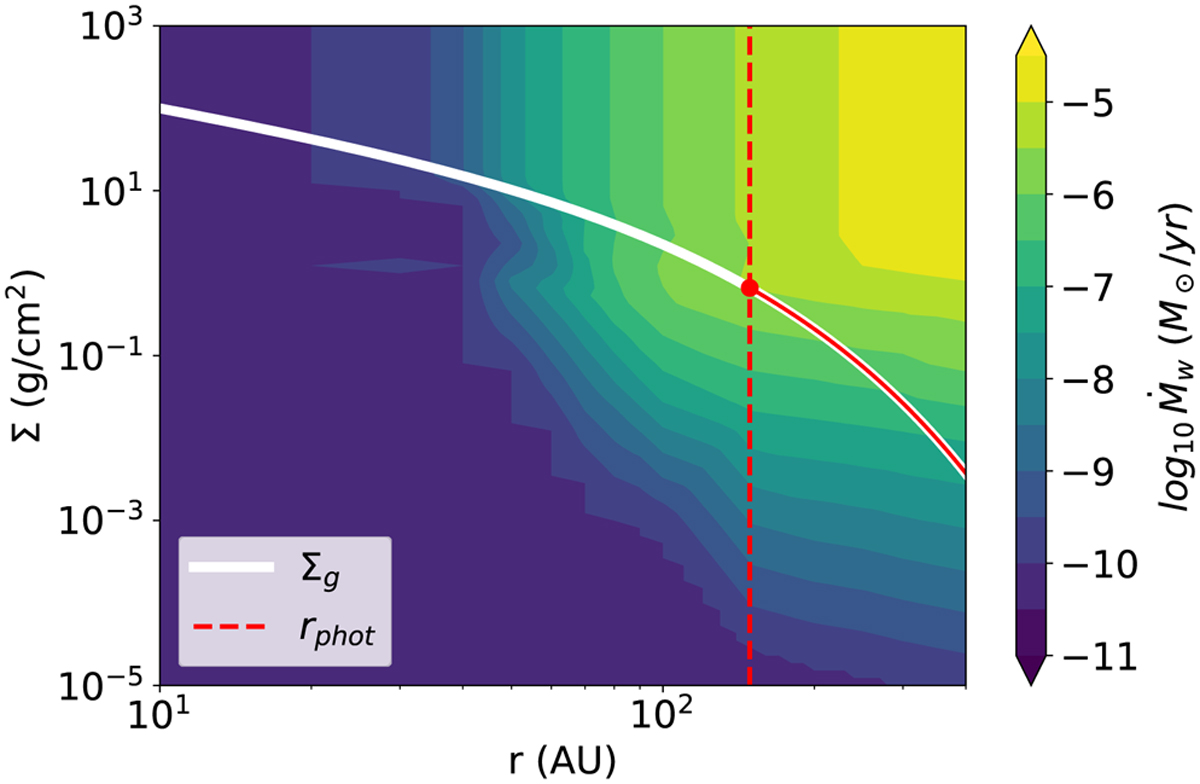
Example mass loss rate grid for a disk orbiting a 1 M⊙ star subject to an irradiation of FUV = 103 G0. The grid determines the gas mass loss ![]() as a function of the gas surface density Σg and radii r, using the FRIED grid from Haworth et al. (2018) and the implementation of Sellek et al. (2020). The solid white line, shows an example gas surface density profile, the dashed vertical line indicates the photoevaporative truncation radius rphot, and the solid red line indicates the regions which are subject to external photoevaporation. The photoevaporation radius evolves with the simulation, and corresponds to the maximum of the mass loss rate along the current surface density profile.
as a function of the gas surface density Σg and radii r, using the FRIED grid from Haworth et al. (2018) and the implementation of Sellek et al. (2020). The solid white line, shows an example gas surface density profile, the dashed vertical line indicates the photoevaporative truncation radius rphot, and the solid red line indicates the regions which are subject to external photoevaporation. The photoevaporation radius evolves with the simulation, and corresponds to the maximum of the mass loss rate along the current surface density profile.
Current usage metrics show cumulative count of Article Views (full-text article views including HTML views, PDF and ePub downloads, according to the available data) and Abstracts Views on Vision4Press platform.
Data correspond to usage on the plateform after 2015. The current usage metrics is available 48-96 hours after online publication and is updated daily on week days.
Initial download of the metrics may take a while.