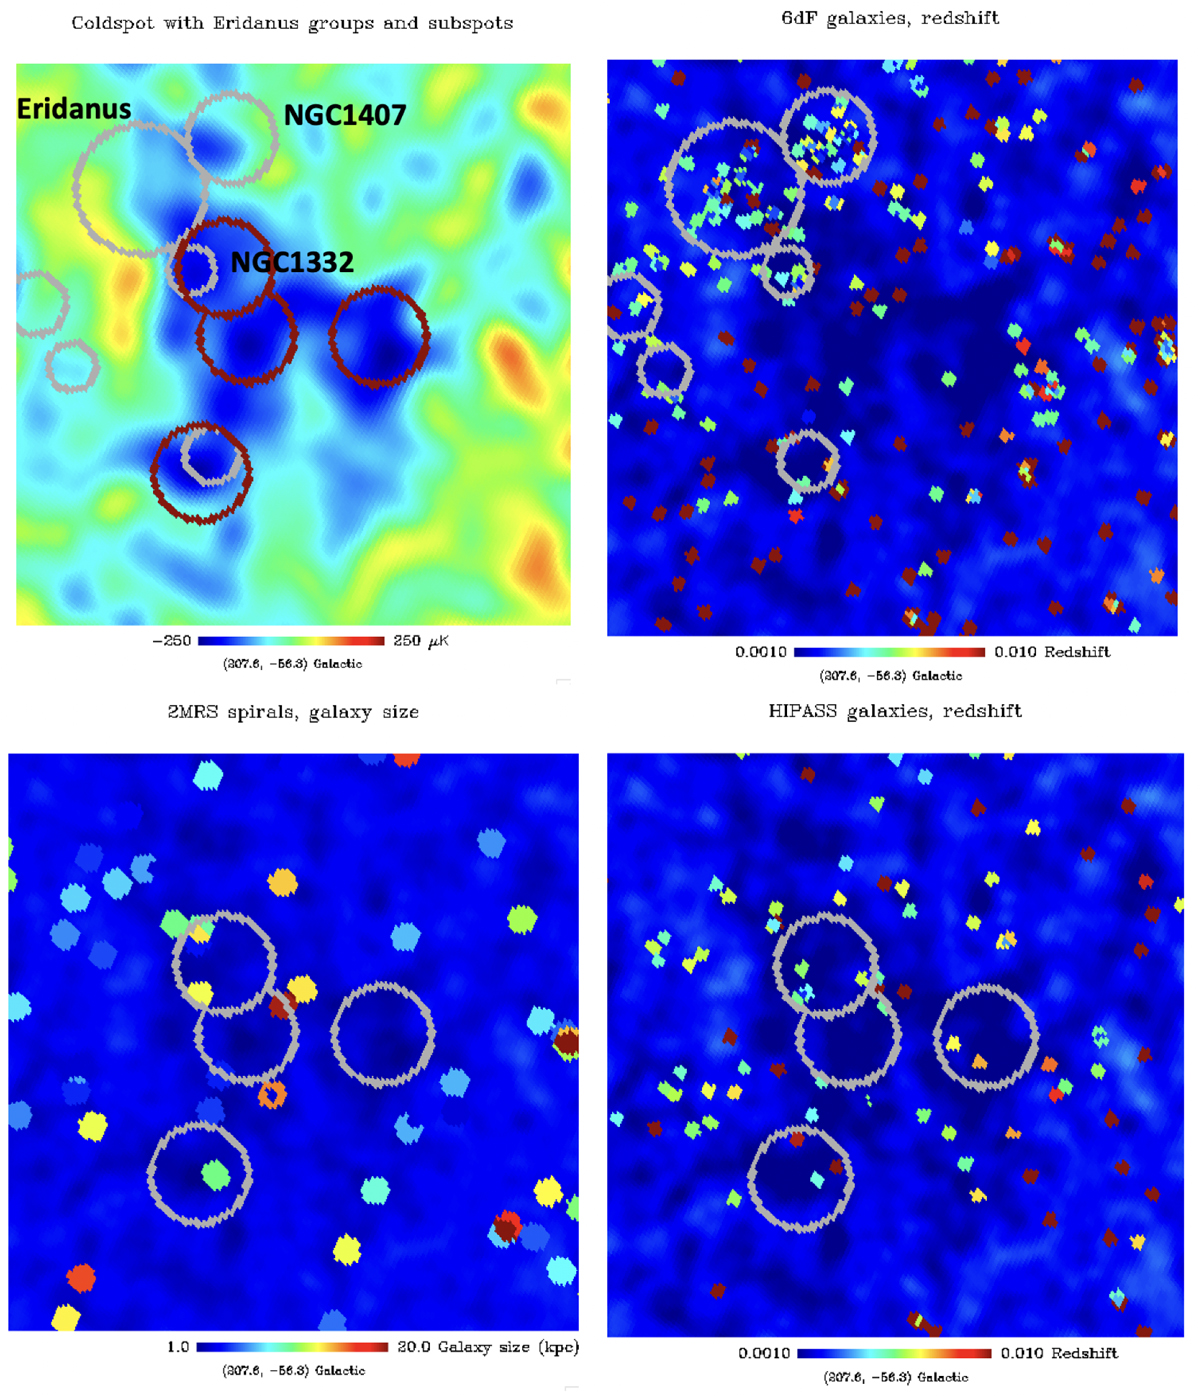
Fig. 6.
Download original image
Galaxy groups and analysed galaxies in the Cold Spot area. In the upper plots, grey circles show the galaxy groups from Fig. 5 of Brough et al. (2006). In the lower plots, grey circles show the subspots as defined in Cruz et al. (2005). In the upper left plot these subspots are shown as red circles. Upper-left panel: CMB Cold Spot. Right panels: galaxies from 6dF (upper) and HIPASS (lower) catalogues, colour-coded with redshift. Lower-left panel: 2MRS spirals colour coded with galaxy size.
Current usage metrics show cumulative count of Article Views (full-text article views including HTML views, PDF and ePub downloads, according to the available data) and Abstracts Views on Vision4Press platform.
Data correspond to usage on the plateform after 2015. The current usage metrics is available 48-96 hours after online publication and is updated daily on week days.
Initial download of the metrics may take a while.