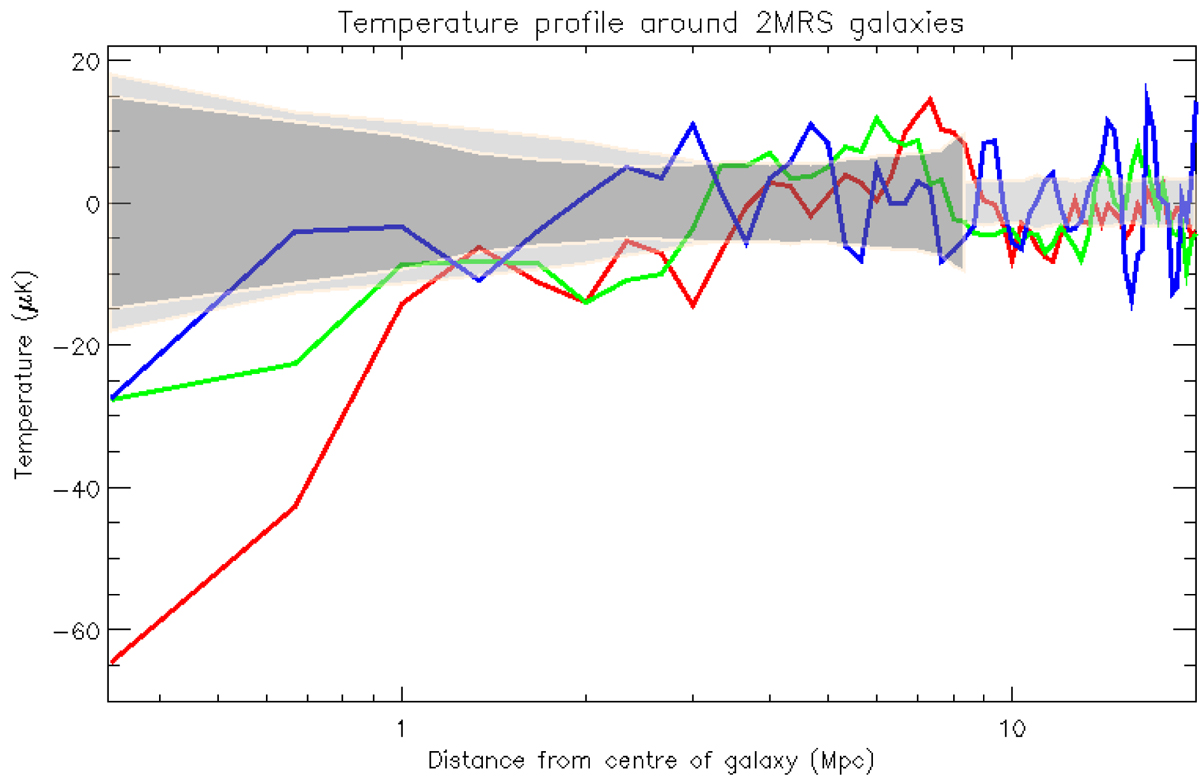
Fig. 1.
Download original image
Mean temperature profiles around galaxies in the Cold Spot area. Red line: large (> 8.5 kpc) 2MRS spirals within 20° from the centre of the Cold Spot (12 galaxies). Only galaxies with redshift z < 0.01 were included. The light grey band shows the 1σ spread corresponding to 300 simulated CMB maps. The dark gray band shows the profile corresponding to random positions within the Cold Spot area. Green line: HIPASS spirals not including common 2MRS galaxies (22 galaxies). Blue line: 6dF galaxies in the smaller spiral dominated Eridanus and NGC1407 group areas (41 galaxies). The monopole and dipole estimated inside the Cold Spot area was subtracted from the map before these profiles were calculated.
Current usage metrics show cumulative count of Article Views (full-text article views including HTML views, PDF and ePub downloads, according to the available data) and Abstracts Views on Vision4Press platform.
Data correspond to usage on the plateform after 2015. The current usage metrics is available 48-96 hours after online publication and is updated daily on week days.
Initial download of the metrics may take a while.