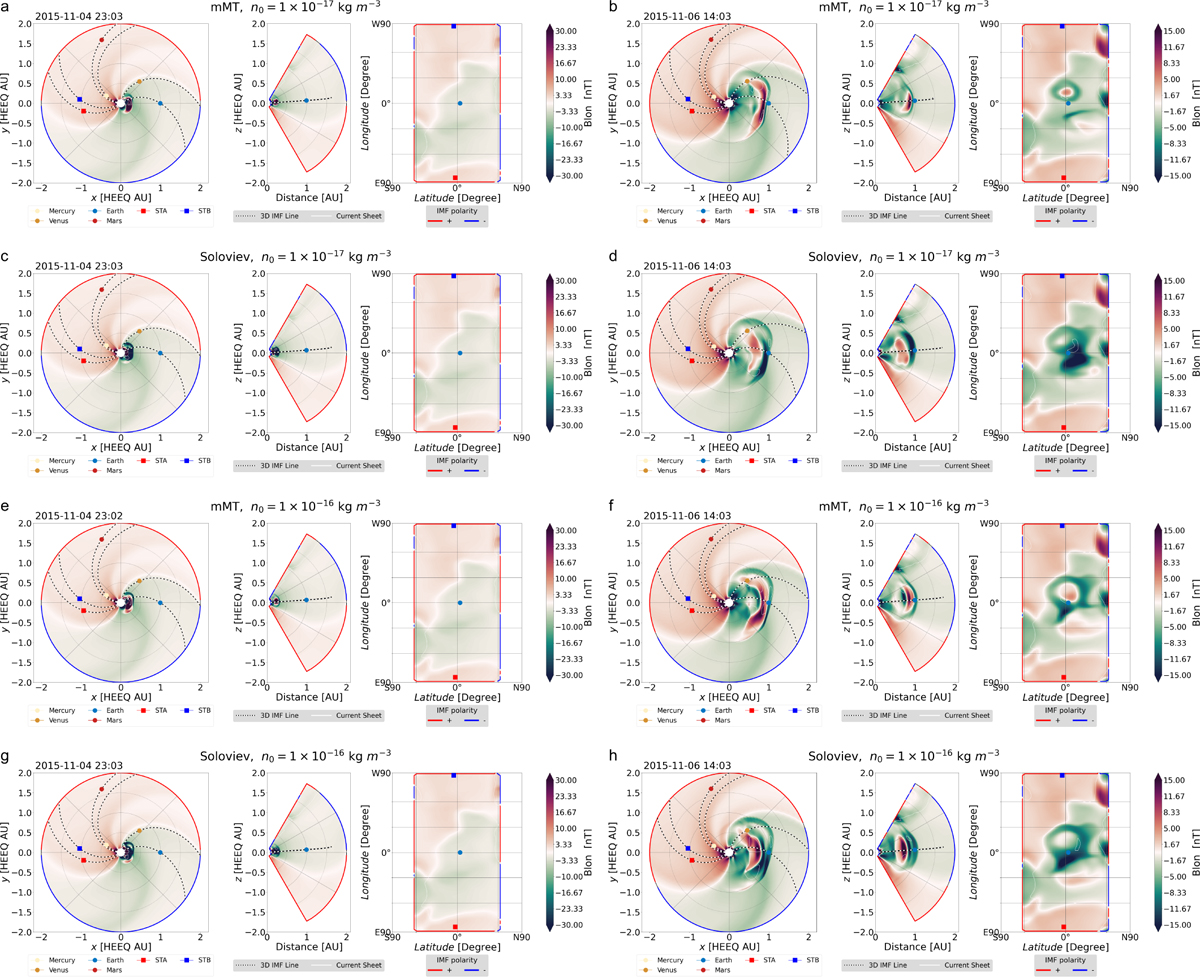
Fig. 8
Download original image
Visualization of the longitudinal magnetic field component in the EUHFORIA heliosphere domain. For both CME models, two initial mass densities were used: n0 = 1 × 10⁻¹⁶ kg m−3 (panels a and b for the mMT CME model and panels c and d for the Soloviev CME model) and n0 = 1 × 10⁻¹⁶ kg m−3 (panels e and f for the mMT CME model and panels g and h for the Soloviev CME model). The geometrical, magnetic, and thermodynamic parameters of the CMEs are described in Sect. 4.2.1. The left panels (a, c, e, g) show the evolution of the longitudinal field, Blon, on March 4 while the right panels (b, d, f, h) show the simulation on November 6. Each panel is divided into an equatorial cross section, a meridional cross section passing through the Sun and the Earth, and a Mercator projection at 0.1 AU from the Sun. The visualization displays the positions of the different planets in the simulation domain, the location of the current sheet, and the interplanetary magnetic field connecting the Sun and the planets, obtained from Parker spirals.
Current usage metrics show cumulative count of Article Views (full-text article views including HTML views, PDF and ePub downloads, according to the available data) and Abstracts Views on Vision4Press platform.
Data correspond to usage on the plateform after 2015. The current usage metrics is available 48-96 hours after online publication and is updated daily on week days.
Initial download of the metrics may take a while.