Fig. 9.
Download original image
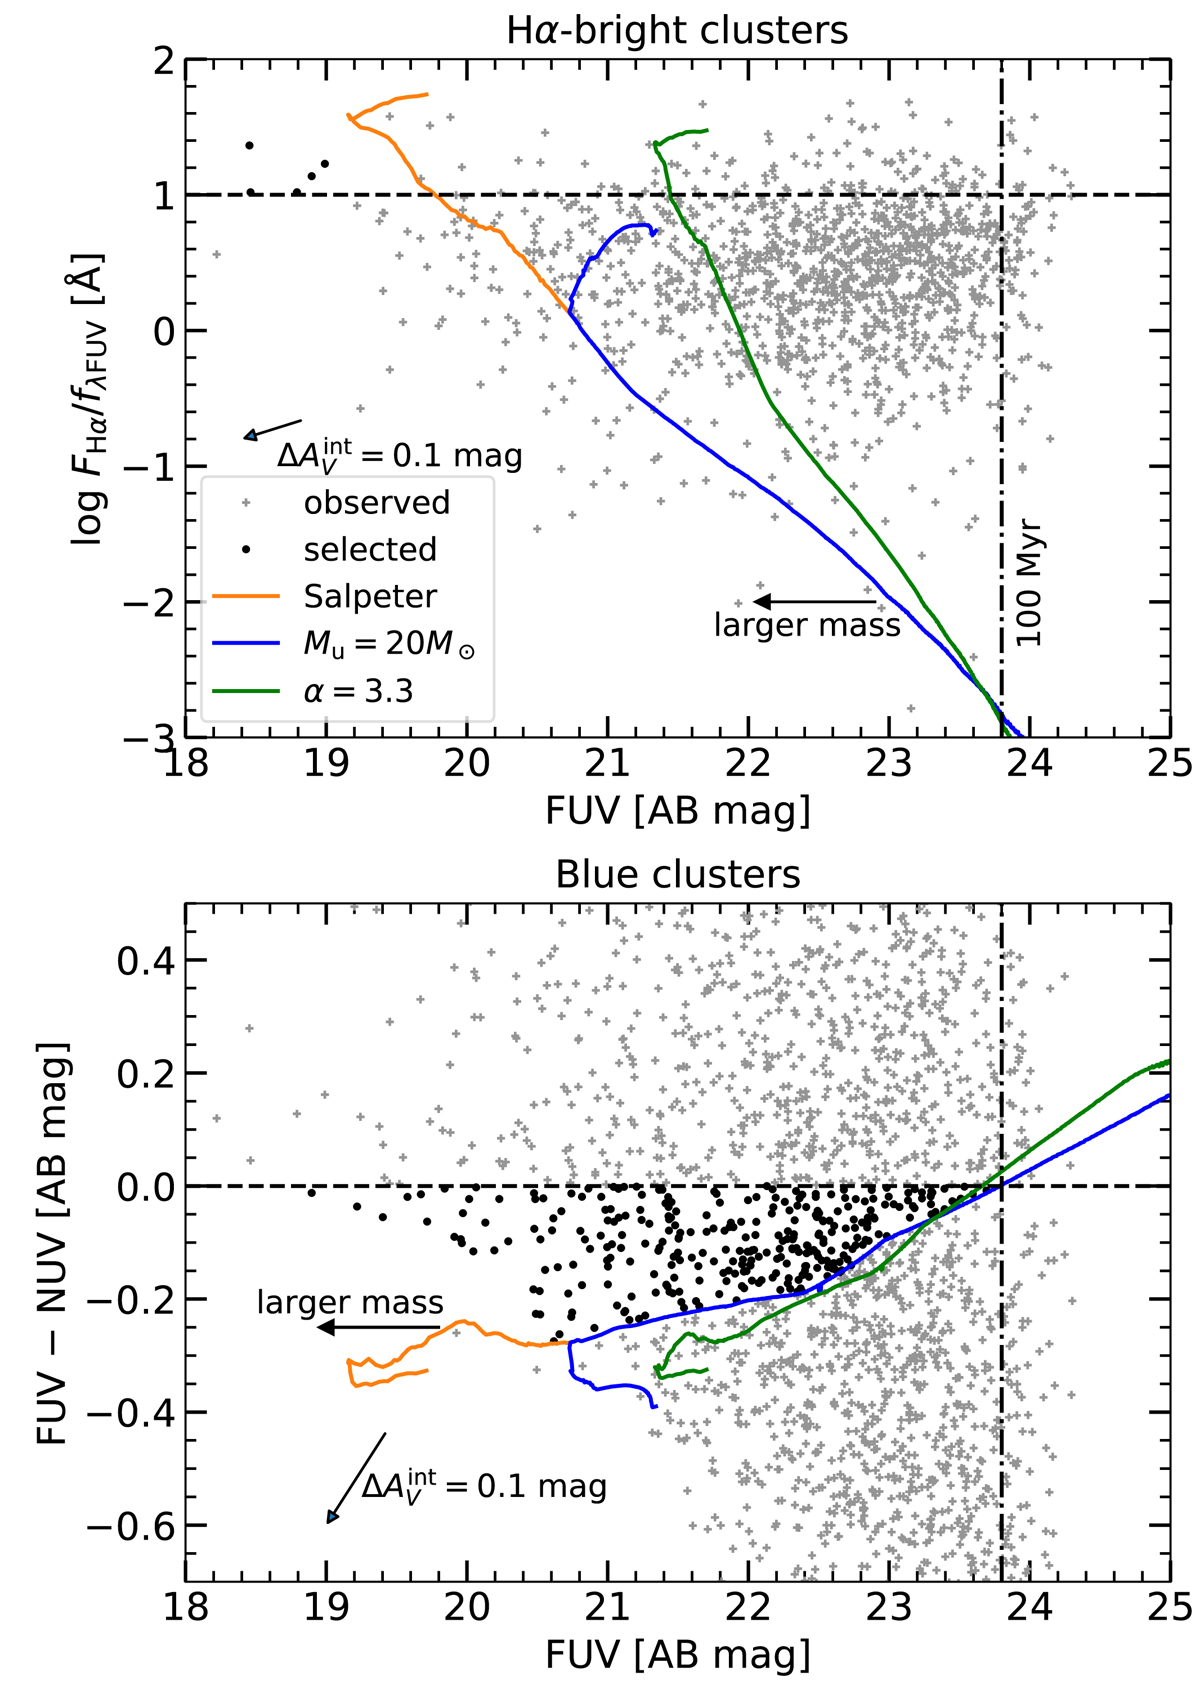
Color-magnitude diagrams for the IN objects. Top panel: comparison of log(FHα/fλFUV) vs. FUV magnitude. The model evolutionary sequences for the standard Salpeter IMF (orange) and the most extreme truncated (Mu = 20 M⊙; blue) and steep (α = 3.3; green) IMFs are shown as solid curves. The mass of each model cluster has been normalized so that they reach an age of 100 Myr at a FUV = 23.8 mag (marked with a vertical dot-dashed line). The direction of increasing cluster mass for the models is shown with a horizontal black arrow. The horizontal dashed line indicates the demarcation for Hα-bright clusters. The Hα-bright clusters that are also above the Salpeter mass completeness limit are marked with black dots. The observed points have been corrected for ![]() measured from the H I data and
measured from the H I data and ![]() . The change in the position of observed points if
. The change in the position of observed points if ![]() is assumed to be larger by 0.1 mag is also shown with a black arrow. Bottom panel: same as the top panel but for FUV−NUV vs. FUV and with blue clusters marked with black dots. We used CMDs to find the Hα-bright and blue clusters in our complete samples.
is assumed to be larger by 0.1 mag is also shown with a black arrow. Bottom panel: same as the top panel but for FUV−NUV vs. FUV and with blue clusters marked with black dots. We used CMDs to find the Hα-bright and blue clusters in our complete samples.
Current usage metrics show cumulative count of Article Views (full-text article views including HTML views, PDF and ePub downloads, according to the available data) and Abstracts Views on Vision4Press platform.
Data correspond to usage on the plateform after 2015. The current usage metrics is available 48-96 hours after online publication and is updated daily on week days.
Initial download of the metrics may take a while.