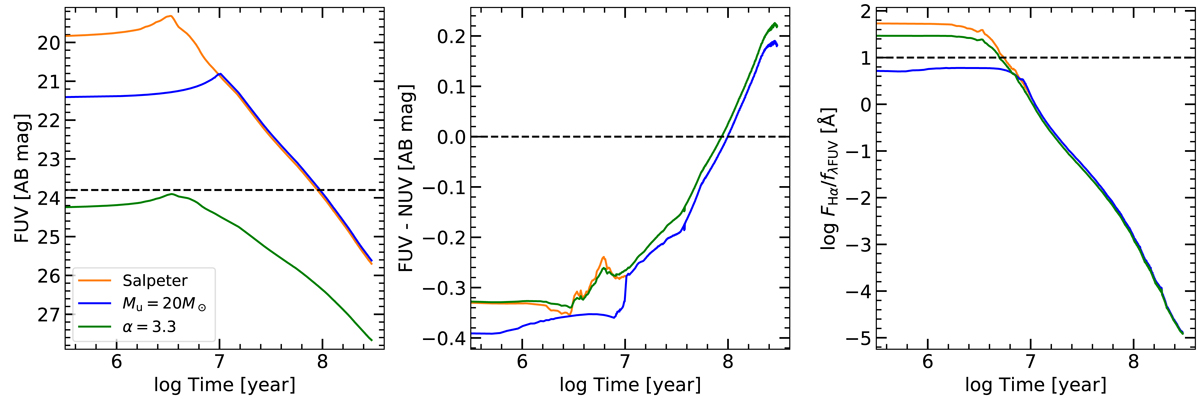
Fig. 8.
Download original image
Photometric evolution of our instantaneous burst STARBURST99 models. The standard Salpeter (1955) IMF is shown in orange, while a truncated IMF (at 20 M⊙) is shown in blue, and a steep IMF (α = 3.3) is shown in green. Left panel: time evolution of FUV magnitude for a cluster mass of 2000 M⊙. The horizontal dashed line shows the detection limit for our sample (FUV = 23.8 mag). Middle panel: time evolution of FUV−NUV color. The horizontal dashed line shows the cut for blue clusters (FUV−NUV = 0). Right panel: time evolution of log(FHα/fλFUV). The horizontal dashed line shows the cut for Hα-bright clusters (log(FHα/fλFUV) = 1).
Current usage metrics show cumulative count of Article Views (full-text article views including HTML views, PDF and ePub downloads, according to the available data) and Abstracts Views on Vision4Press platform.
Data correspond to usage on the plateform after 2015. The current usage metrics is available 48-96 hours after online publication and is updated daily on week days.
Initial download of the metrics may take a while.