Fig. 7.
Download original image
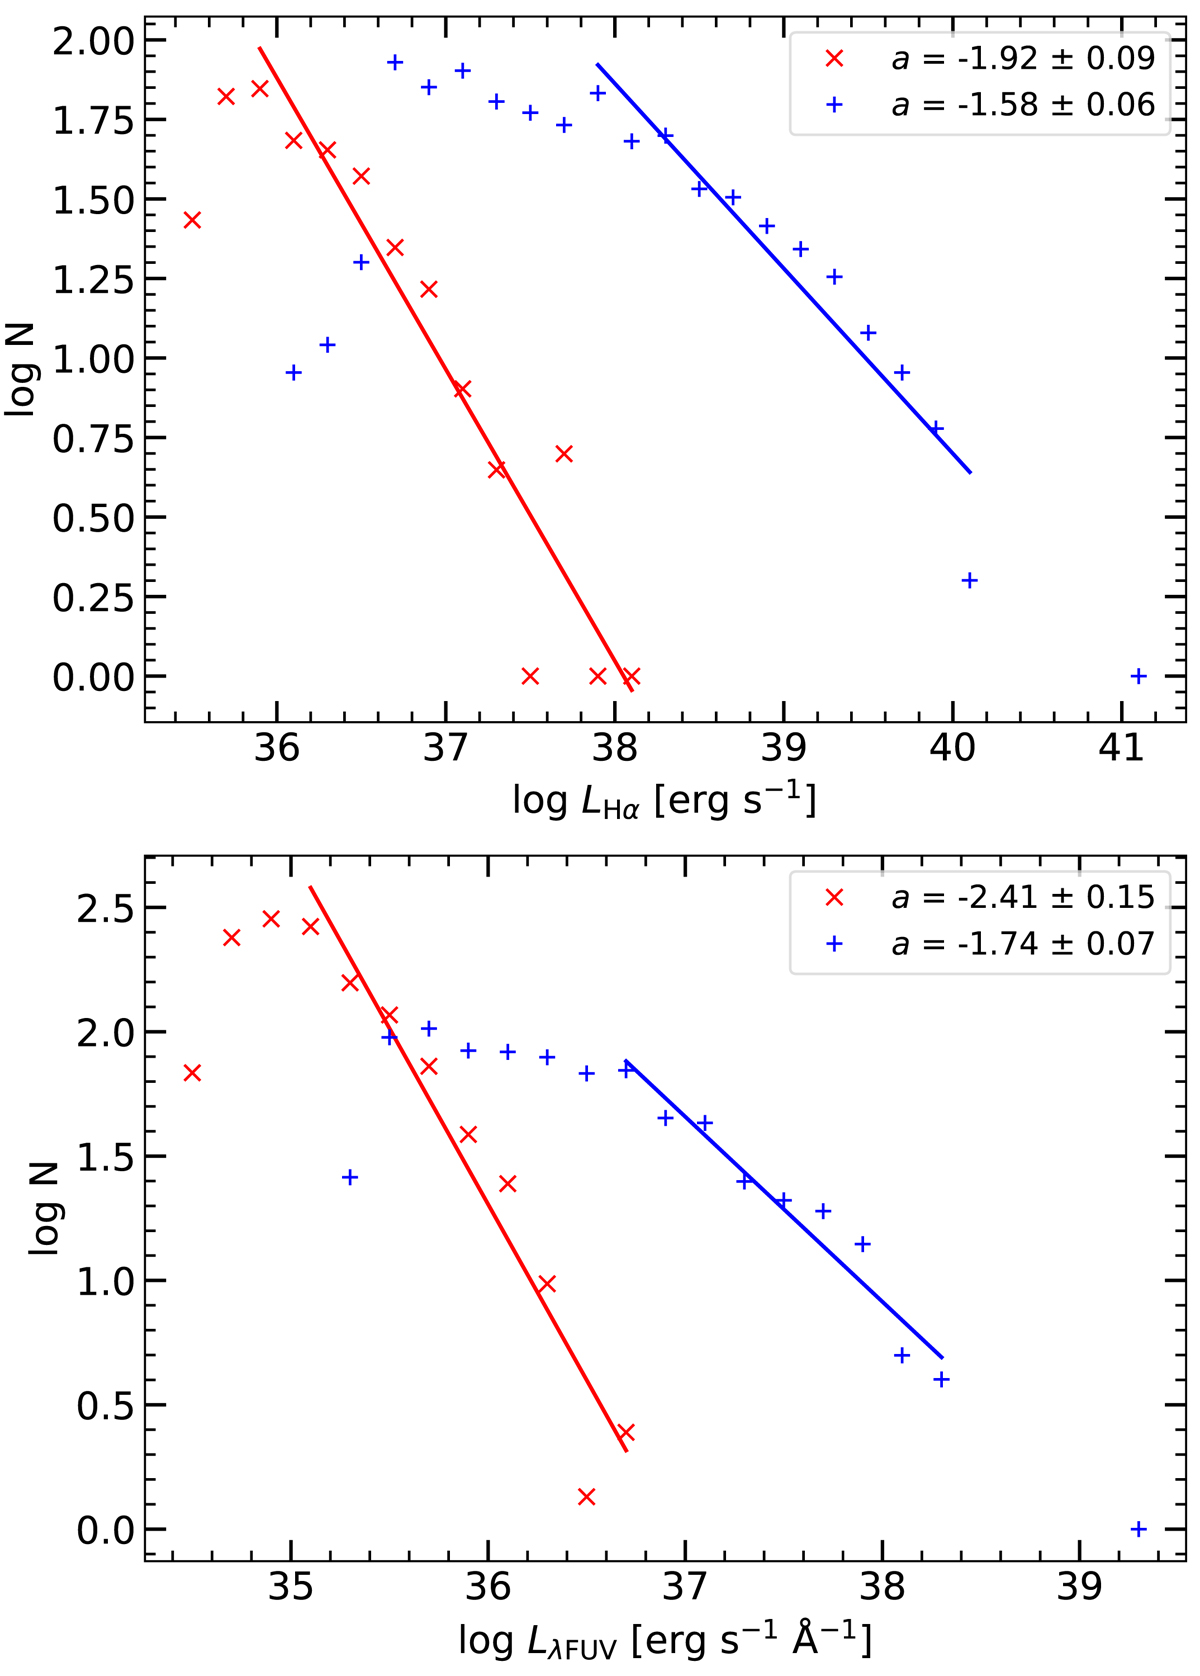
Luminosity functions for M 83. The red crosses correspond to outer disk objects and the blue plus signs to inner disk objects. The solid lines indicate the best fit and the range in log L over which the fit was made. The slopes of the best fits (a) are given in the legend. Top panel: Hα luminosity functions. Bottom panel: FUV luminosity functions.
Current usage metrics show cumulative count of Article Views (full-text article views including HTML views, PDF and ePub downloads, according to the available data) and Abstracts Views on Vision4Press platform.
Data correspond to usage on the plateform after 2015. The current usage metrics is available 48-96 hours after online publication and is updated daily on week days.
Initial download of the metrics may take a while.