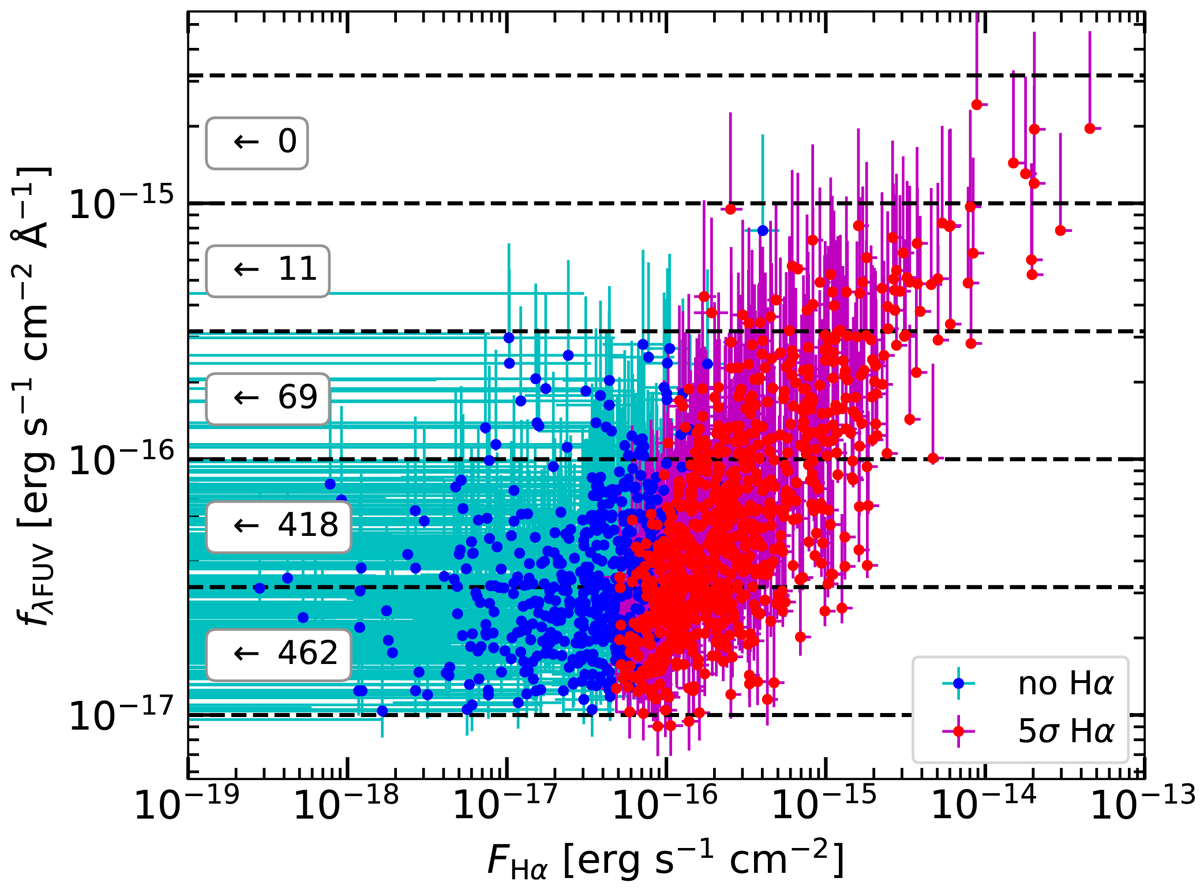
Fig. 5.
Download original image
Hα flux compared against FUV flux for the IN objects in our sample. The red dots are the objects with a 5σ Hα detection, and the blue dots are the objects without a 5σ Hα detection. The magenta and cyan lines give the error bars. The error bars are mainly due to uncertainty in extinction (see Sect. 3.5). The dashed horizontal lines split the sample into logarithmic bins according to their FUV flux. The number of objects with negative Hα flux for each bin is shown on the left.
Current usage metrics show cumulative count of Article Views (full-text article views including HTML views, PDF and ePub downloads, according to the available data) and Abstracts Views on Vision4Press platform.
Data correspond to usage on the plateform after 2015. The current usage metrics is available 48-96 hours after online publication and is updated daily on week days.
Initial download of the metrics may take a while.