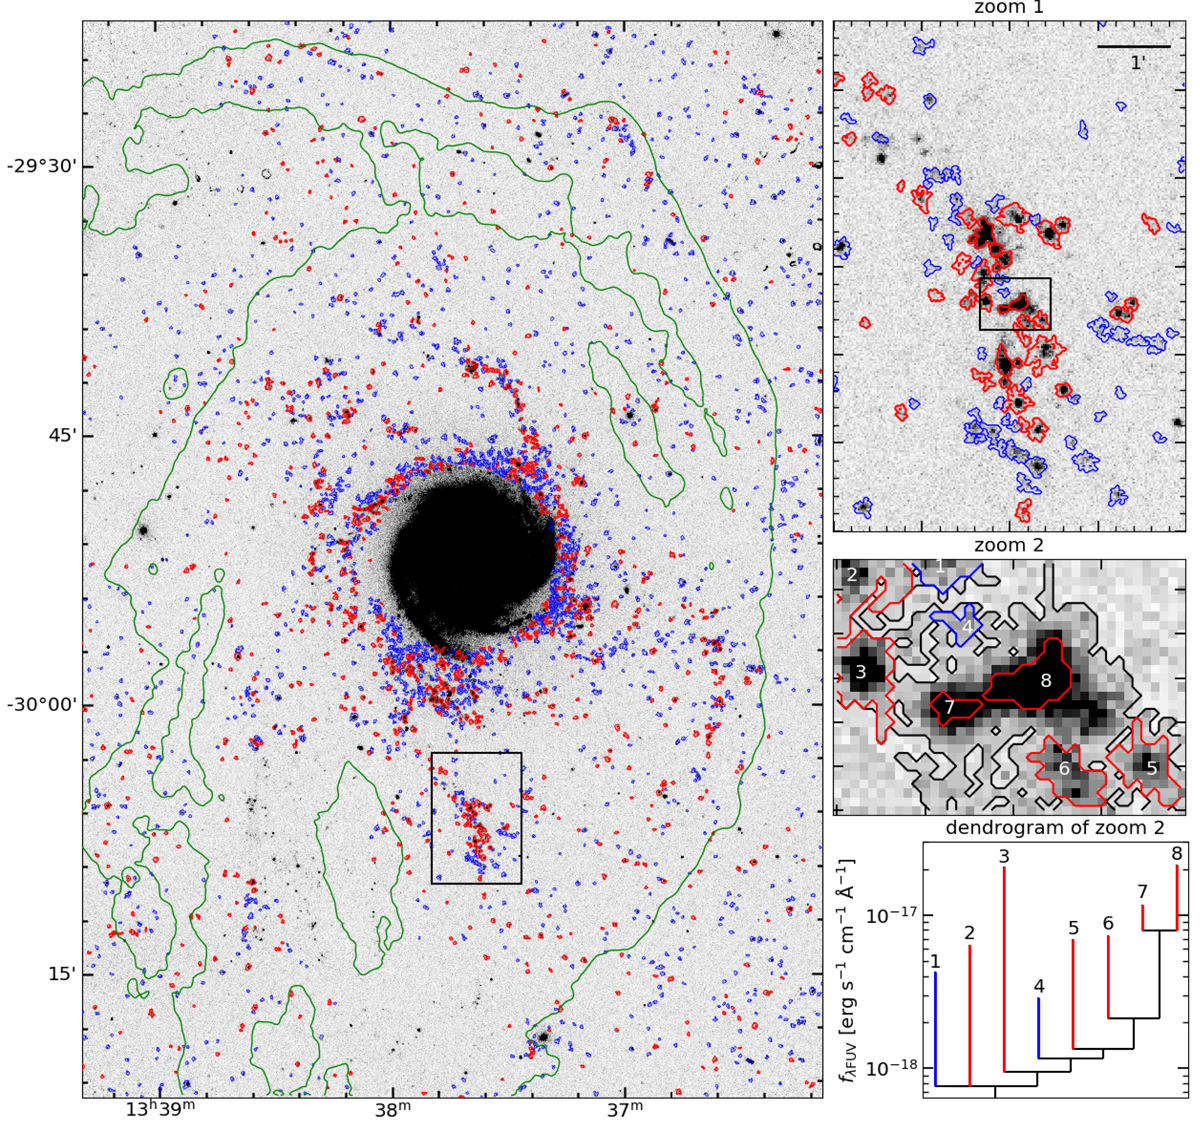
Fig. 4.
Download original image
Dendrogram derived isophotal apertures of our sample objects. Left panel: apertures of our sample objects plotted over the GALEX FUV image. Objects with 5σ Hα detection are outlined in red, while objects without 5σ Hα detection are outlined in blue. Objects flagged as belonging to the background, foreground, or artifacts, or with missing Hα data, are not shown. The green contour shows the 5 × 1019 cm−2 H I column density level from LVHIS (Koribalski et al. 2018). Top-right panel: zoom in of section outlined with a black rectangle in the left panel. A one arcminute scale bar is shown in the top-right corner. Middle-right panel: further zoom in of the section outlined with a black rectangle in the top-right panel. The lowest dendrogram level is outlined with a black contour. The objects within this zoomed in section are labeled with white numbers ranging from one to eight. Bottom-right panel: dendrogram of the data within the middle-right panel. The leaves corresponding with the objects in the middle-right panel are labeled with the same numbers as in the middle-right panel. The y-axis corresponds to the peak pixel flux within each leaf or the pixel flux in the saddle point between branches.
Current usage metrics show cumulative count of Article Views (full-text article views including HTML views, PDF and ePub downloads, according to the available data) and Abstracts Views on Vision4Press platform.
Data correspond to usage on the plateform after 2015. The current usage metrics is available 48-96 hours after online publication and is updated daily on week days.
Initial download of the metrics may take a while.