Fig. 3.
Download original image
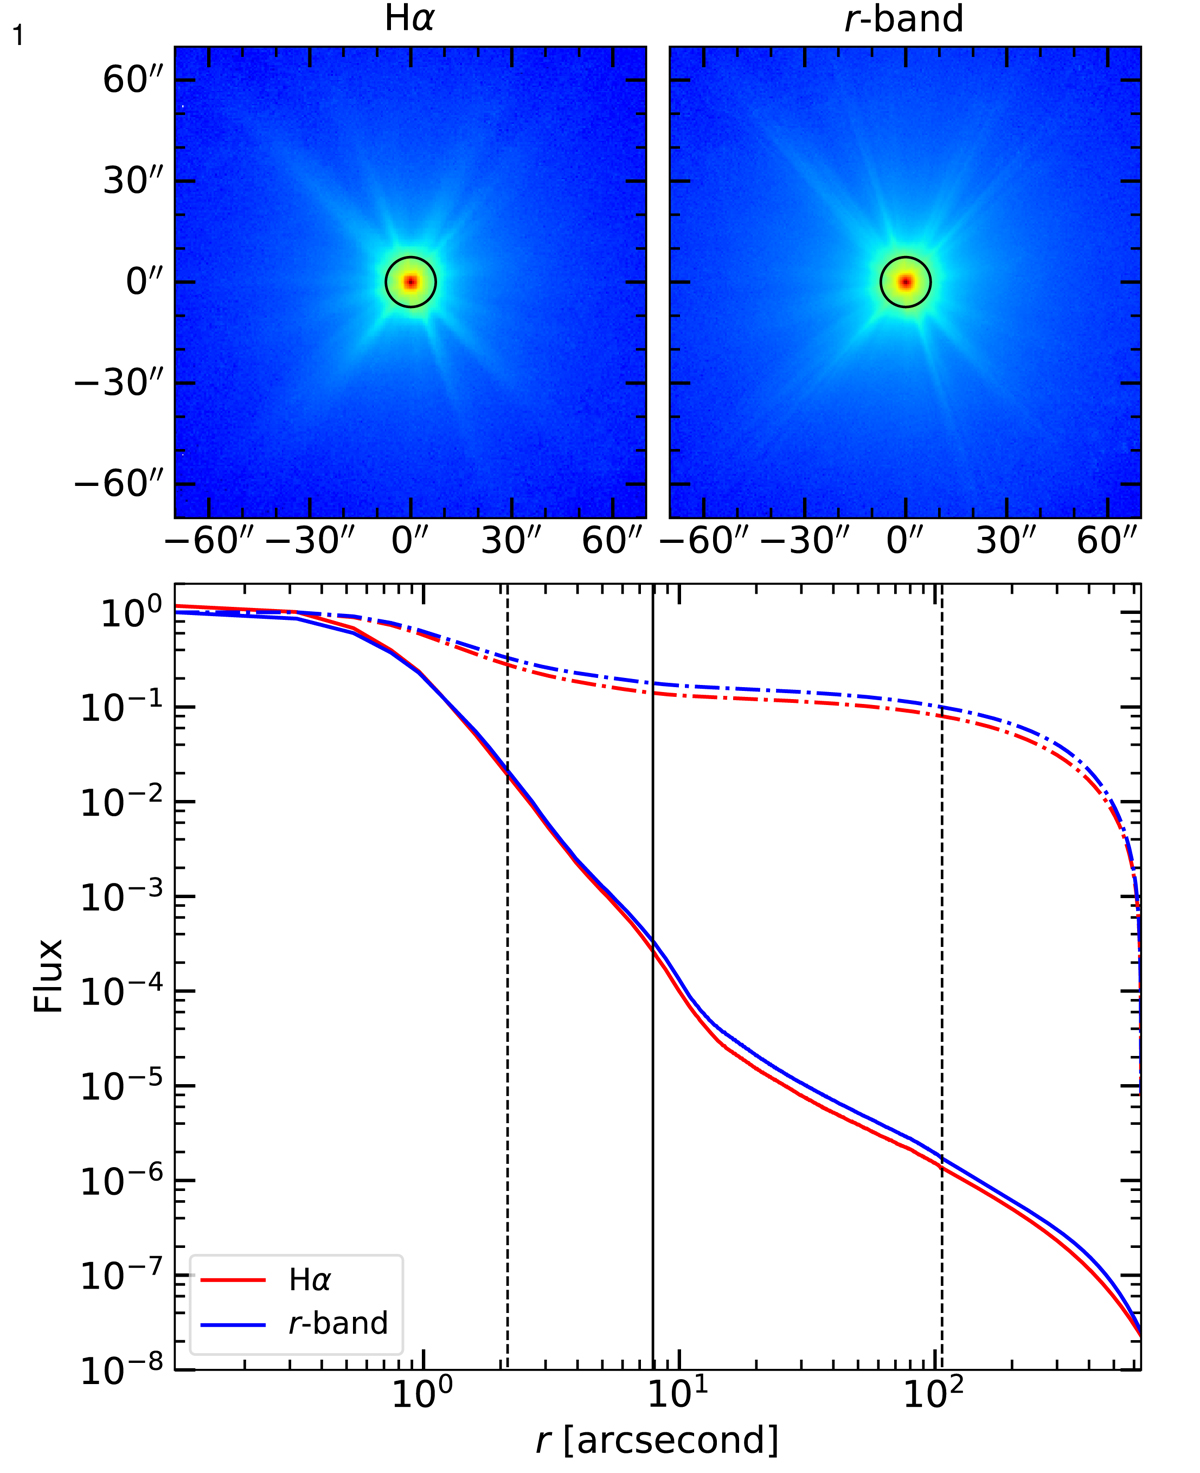
Point spread functions of our OmegaCAM data. Top-left panel: inner parts of the Hα PSF. Top-right panel: inner parts of the r-band PSF. Bottom panel: radial profile of the extended Hα PSF (red curves) and r-band PSF (blue curves). The r-band PSF is normalized to its maximum value, and the Hα PSF is normalized so that it has a total flux equal to the r-band PSF. The dot-dashed curves show the fractional cumulative flux outside a given distance from the center. The black vertical lines correspond to the separations between the different parts of the PSFs (2″, 8″, and 100″; see text). The separation between the two middle parts (solid black line at 8″) is also shown in the top panels as a black circle.
Current usage metrics show cumulative count of Article Views (full-text article views including HTML views, PDF and ePub downloads, according to the available data) and Abstracts Views on Vision4Press platform.
Data correspond to usage on the plateform after 2015. The current usage metrics is available 48-96 hours after online publication and is updated daily on week days.
Initial download of the metrics may take a while.