Fig. 15.
Download original image
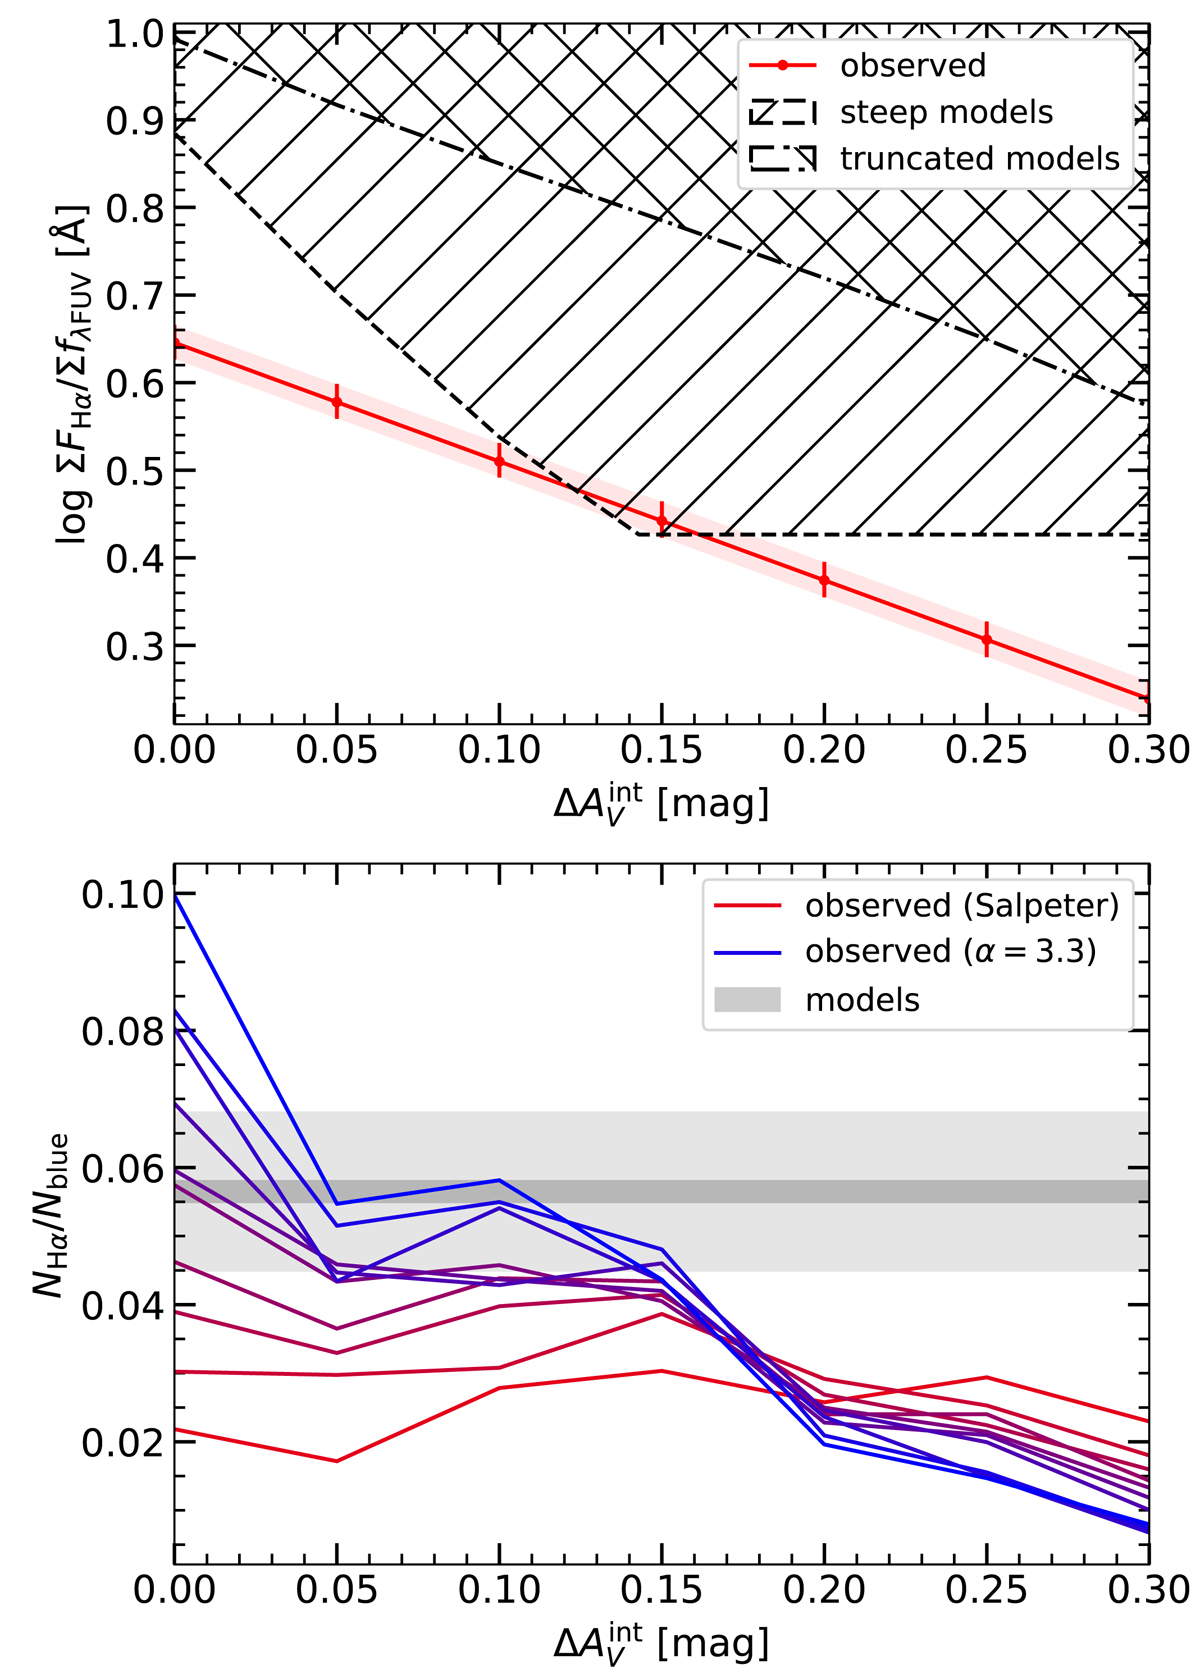
Effect of varying the internal extinction. Top panel: comparison of log(ΣFHα/ΣfλFUV) in our catalog vs. the assumed ![]() . The dashed curve shows the logarithm of the minimum predicted ΣFHα/ΣfλFUV among our steep IMF models that are capable of producing clusters with as high a maximum FHα/fλFUV as the maximum FHα/fλFUV observed (southwest to northeast hatches) for each
. The dashed curve shows the logarithm of the minimum predicted ΣFHα/ΣfλFUV among our steep IMF models that are capable of producing clusters with as high a maximum FHα/fλFUV as the maximum FHα/fλFUV observed (southwest to northeast hatches) for each ![]() . The dot-dashed curve shows the same for our truncated IMF models (northwest to southeast hatches). The curve for the steep IMF models levels out beyond
. The dot-dashed curve shows the same for our truncated IMF models (northwest to southeast hatches). The curve for the steep IMF models levels out beyond ![]() because at that assumed internal extinction and higher, all of our steep IMF models are capable of producing clusters with a maximum FHα/fλFUV higher than the maximum observed, so the log(ΣFHα/ΣfλFUV) value for α = 3.3 is given for all
because at that assumed internal extinction and higher, all of our steep IMF models are capable of producing clusters with a maximum FHα/fλFUV higher than the maximum observed, so the log(ΣFHα/ΣfλFUV) value for α = 3.3 is given for all ![]() . Bottom panel: comparison of NHα/Nblue in our mass-selected catalogs assuming a Salpeter IMF (red curve) and steep IMFs (blue and purple curves) vs. assumed
. Bottom panel: comparison of NHα/Nblue in our mass-selected catalogs assuming a Salpeter IMF (red curve) and steep IMFs (blue and purple curves) vs. assumed ![]() . The values predicted by our steep IMF models are shown by the gray shaded area. The darker shaded area is between the highest and lowest value predicted by our steep IMF models, and the lighter shaded area is ±0.01 around the darker shaded area, corresponding to the typical errors for NHα/Nblue in our analysis. Observations agree with steep IMF models when 0.10 <
. The values predicted by our steep IMF models are shown by the gray shaded area. The darker shaded area is between the highest and lowest value predicted by our steep IMF models, and the lighter shaded area is ±0.01 around the darker shaded area, corresponding to the typical errors for NHα/Nblue in our analysis. Observations agree with steep IMF models when 0.10 < ![]() < 0.15 mag is assumed.
< 0.15 mag is assumed.
Current usage metrics show cumulative count of Article Views (full-text article views including HTML views, PDF and ePub downloads, according to the available data) and Abstracts Views on Vision4Press platform.
Data correspond to usage on the plateform after 2015. The current usage metrics is available 48-96 hours after online publication and is updated daily on week days.
Initial download of the metrics may take a while.