Fig. 13.
Download original image
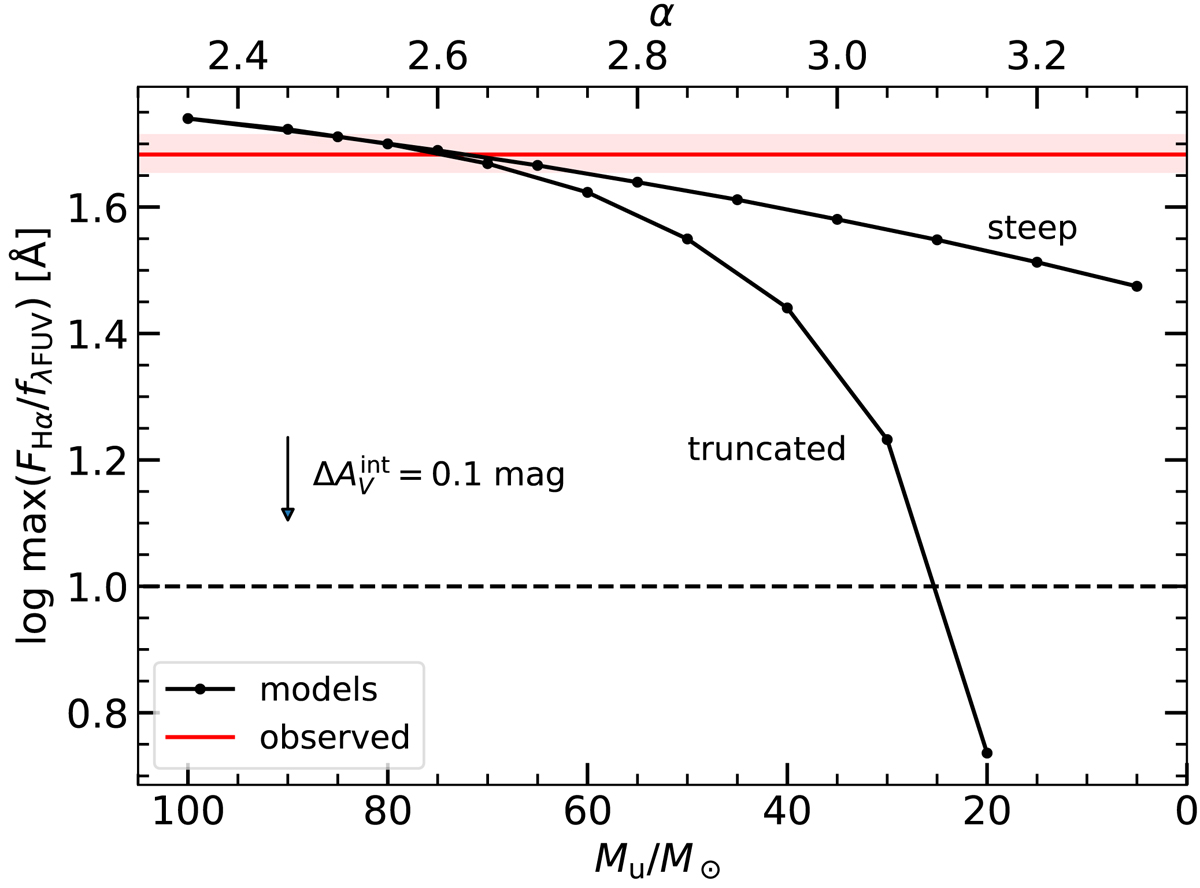
Maximum Hα-to-FUV flux ratios of stellar clusters predicted by our models. The black curves show FHα/fλFUV against IMF slope (α) and truncation mass (Mu) for the set of steep models and the set of truncated models, respectively. The first dot from the left is from the model with the standard Salpeter IMF (α = 2.35, Mu = 100 M⊙). The horizontal red line and shaded area show the maximum observed FHα/fλFUV in our catalog and its errors. The dashed black horizontal line is the limit of Hα brightness that we adopted. The change in the observed flux ratio if ![]() is assumed to be larger by 0.1 mag is shown with a black arrow. Only models with α < 2.8 or Mu > 60 M⊙ can generate clusters with as high a FHα/fλFUV as are observed.
is assumed to be larger by 0.1 mag is shown with a black arrow. Only models with α < 2.8 or Mu > 60 M⊙ can generate clusters with as high a FHα/fλFUV as are observed.
Current usage metrics show cumulative count of Article Views (full-text article views including HTML views, PDF and ePub downloads, according to the available data) and Abstracts Views on Vision4Press platform.
Data correspond to usage on the plateform after 2015. The current usage metrics is available 48-96 hours after online publication and is updated daily on week days.
Initial download of the metrics may take a while.