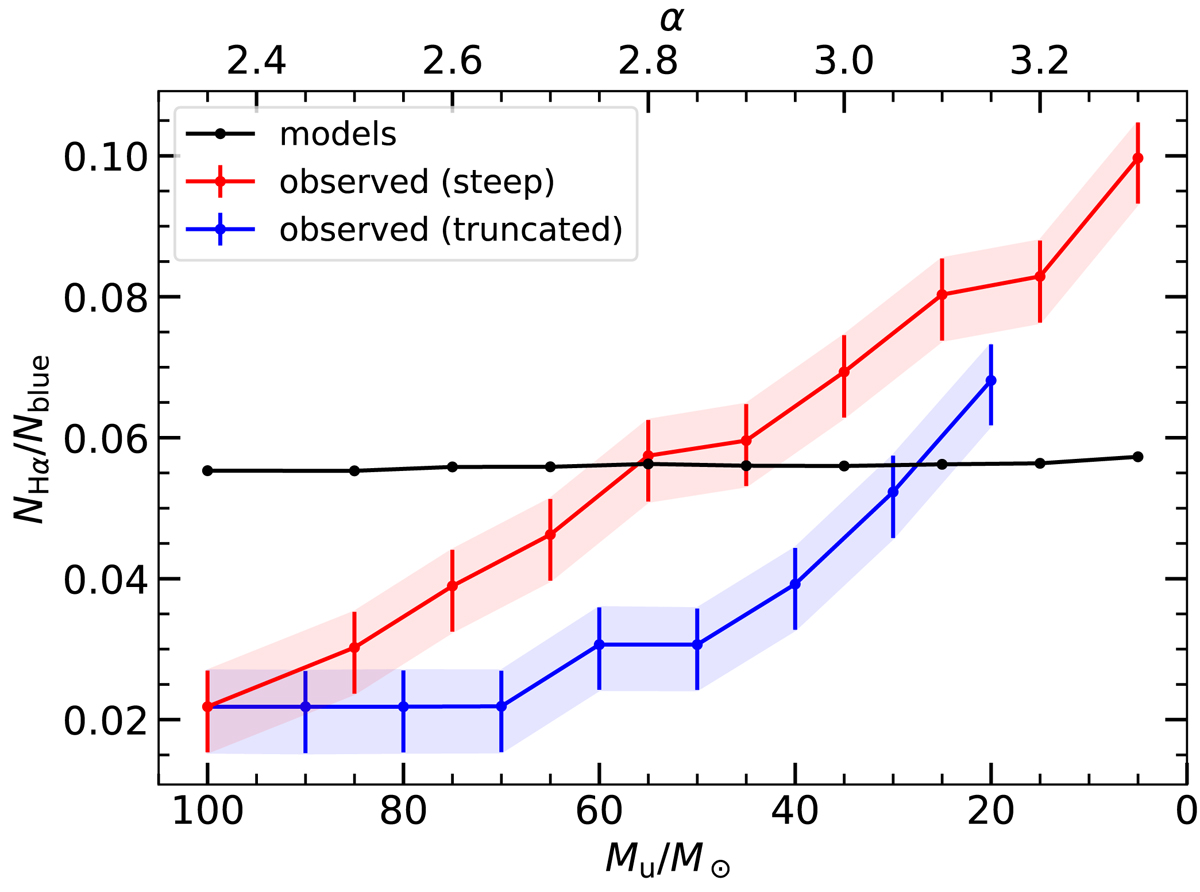
Fig. 12.
Download original image
Observed and modeled NHα/Nblue for different IMFs. The black curve show values predicted by our steep models with different IMF slopes (α). These were obtained as NHα/Nblue = tHα/tblue while assuming instantaneous cluster formation and a constant cluster formation rate. The values predicted by the truncated models are not shown for clarity, but they are very close to the values predicted by the steep models. The first dot from the left is given by the model with the standard Salpeter IMF (α = 2.35). The red curve indicates the observed value in the M 83 outer disk using different mass selection criteria imposed by IMFs with different α. The blue curve is the same as the red curve but for the truncated IMFs with different Mu. The shaded areas around the lines show the errors in the observed values. The observations and models agree for 2.8 ≤ α ≤ 2.9, or Mu ≈ 30 M⊙.
Current usage metrics show cumulative count of Article Views (full-text article views including HTML views, PDF and ePub downloads, according to the available data) and Abstracts Views on Vision4Press platform.
Data correspond to usage on the plateform after 2015. The current usage metrics is available 48-96 hours after online publication and is updated daily on week days.
Initial download of the metrics may take a while.