Fig. 10.
Download original image
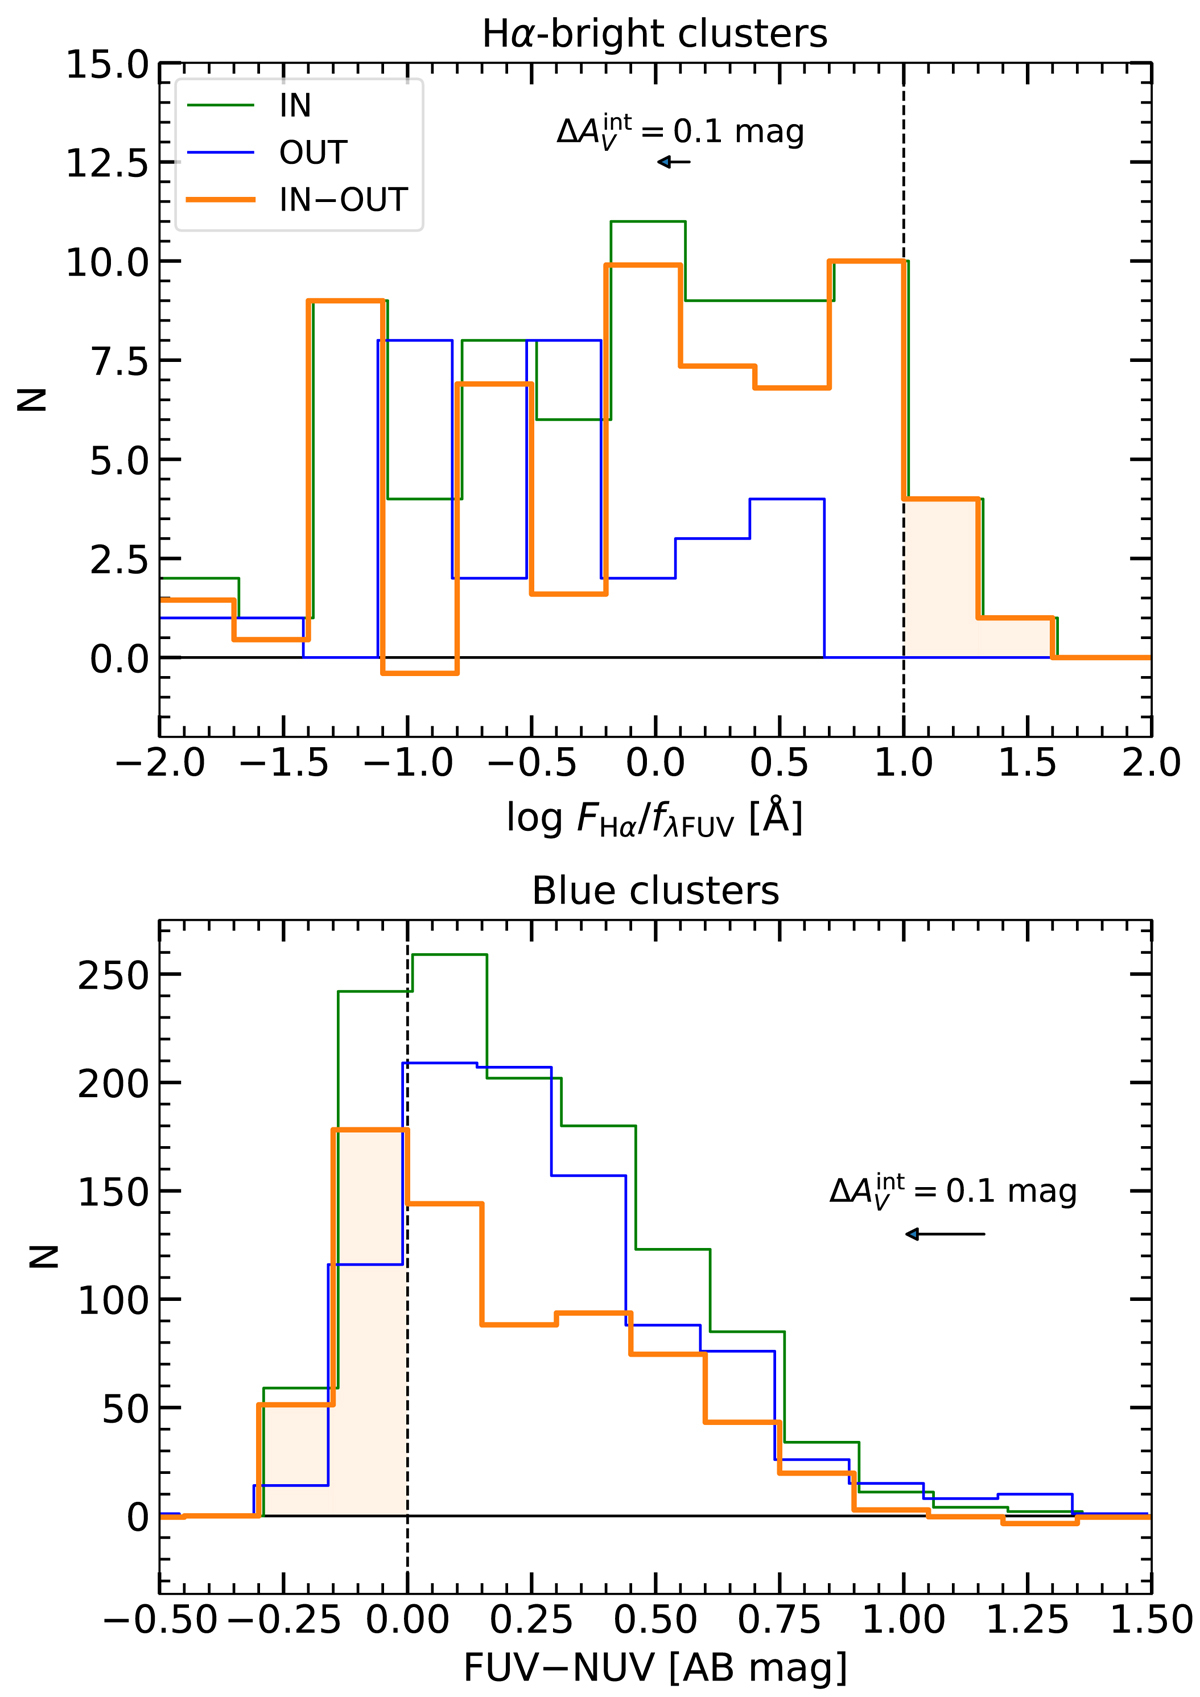
Histograms of the extinction-corrected flux ratios and UV colors of mass-selected objects assuming a Salpeter IMF. Top panel: histogram of log(FHα/fλFUV). The green histogram shows the objects within the H I gas footprint, the blue histogram shows the objects outside it, and the orange histogram shows the star clusters associated with M 83. The orange histogram was obtained by scaling the blue histogram with the IN/OUT area ratio and subtracting it from the green histogram. The change in the flux ratio if ![]() is assumed to be larger by 0.1 mag is shown with a black arrow. Bottom panel: same as the top panel but for FUV−NUV. The shaded parts of the histograms correspond to the Hα-bright (log(FHα/fλFUV) > 1) clusters and the blue (FUV−NUV < 0) clusters, respectively. These histograms illustrate the subtraction of background contamination from our cluster counts.
is assumed to be larger by 0.1 mag is shown with a black arrow. Bottom panel: same as the top panel but for FUV−NUV. The shaded parts of the histograms correspond to the Hα-bright (log(FHα/fλFUV) > 1) clusters and the blue (FUV−NUV < 0) clusters, respectively. These histograms illustrate the subtraction of background contamination from our cluster counts.
Current usage metrics show cumulative count of Article Views (full-text article views including HTML views, PDF and ePub downloads, according to the available data) and Abstracts Views on Vision4Press platform.
Data correspond to usage on the plateform after 2015. The current usage metrics is available 48-96 hours after online publication and is updated daily on week days.
Initial download of the metrics may take a while.