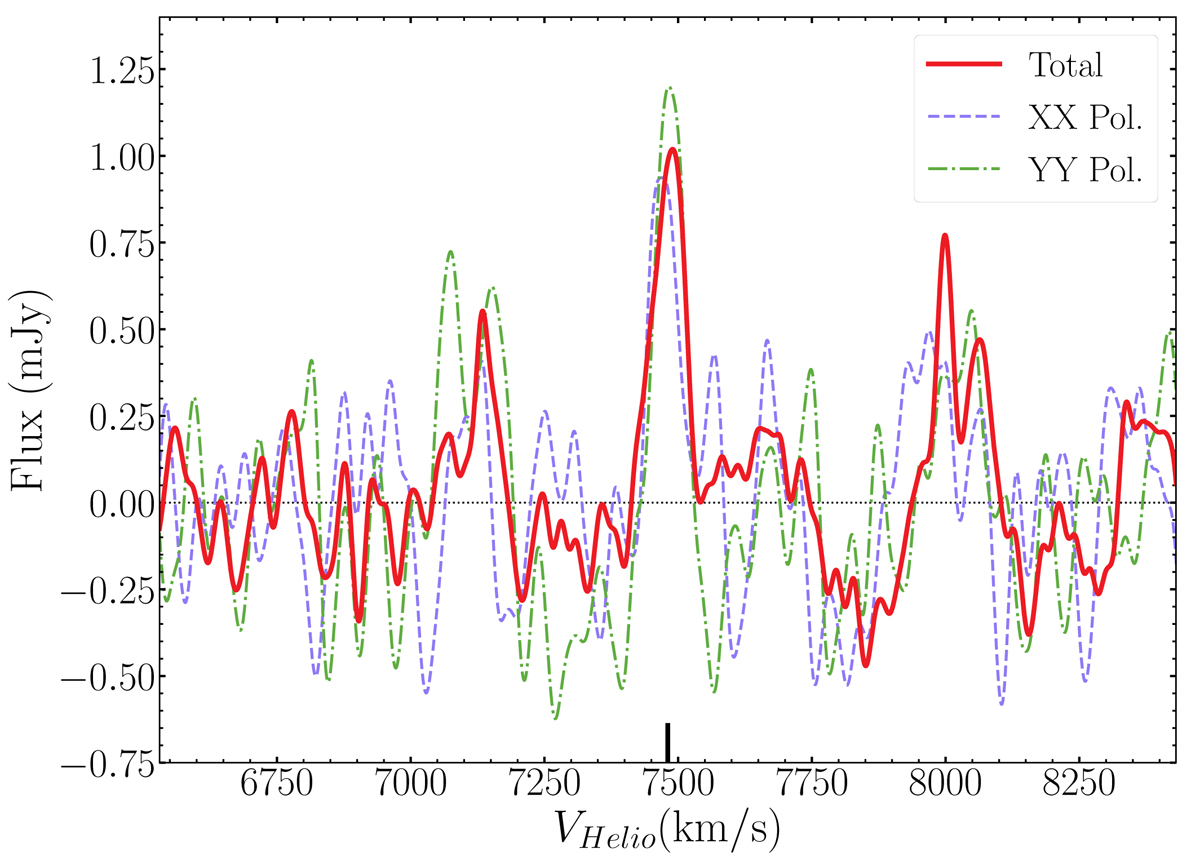
Fig. 2.
Download original image
HI detection along the LOS to Nube. We also show different polarisations of the data, i.e. XX and YY, in order to better identify which other HI emission peaks in the spectrum are potentially spurious. The black tick indicates the location of the peak with the strongest signal in our data. We note that other distinct peaks are not always present in the two different polarisations, which reduces their relevance as real signals.
Current usage metrics show cumulative count of Article Views (full-text article views including HTML views, PDF and ePub downloads, according to the available data) and Abstracts Views on Vision4Press platform.
Data correspond to usage on the plateform after 2015. The current usage metrics is available 48-96 hours after online publication and is updated daily on week days.
Initial download of the metrics may take a while.